Zimbabwean vs Marshallese Married-couple Households
COMPARE
Zimbabwean
Marshallese
Married-couple Households
Married-couple Households Comparison
Zimbabweans
Marshallese
47.4%
MARRIED-COUPLE HOUSEHOLDS
89.2/ 100
METRIC RATING
124th/ 347
METRIC RANK
44.6%
MARRIED-COUPLE HOUSEHOLDS
1.5/ 100
METRIC RATING
232nd/ 347
METRIC RANK
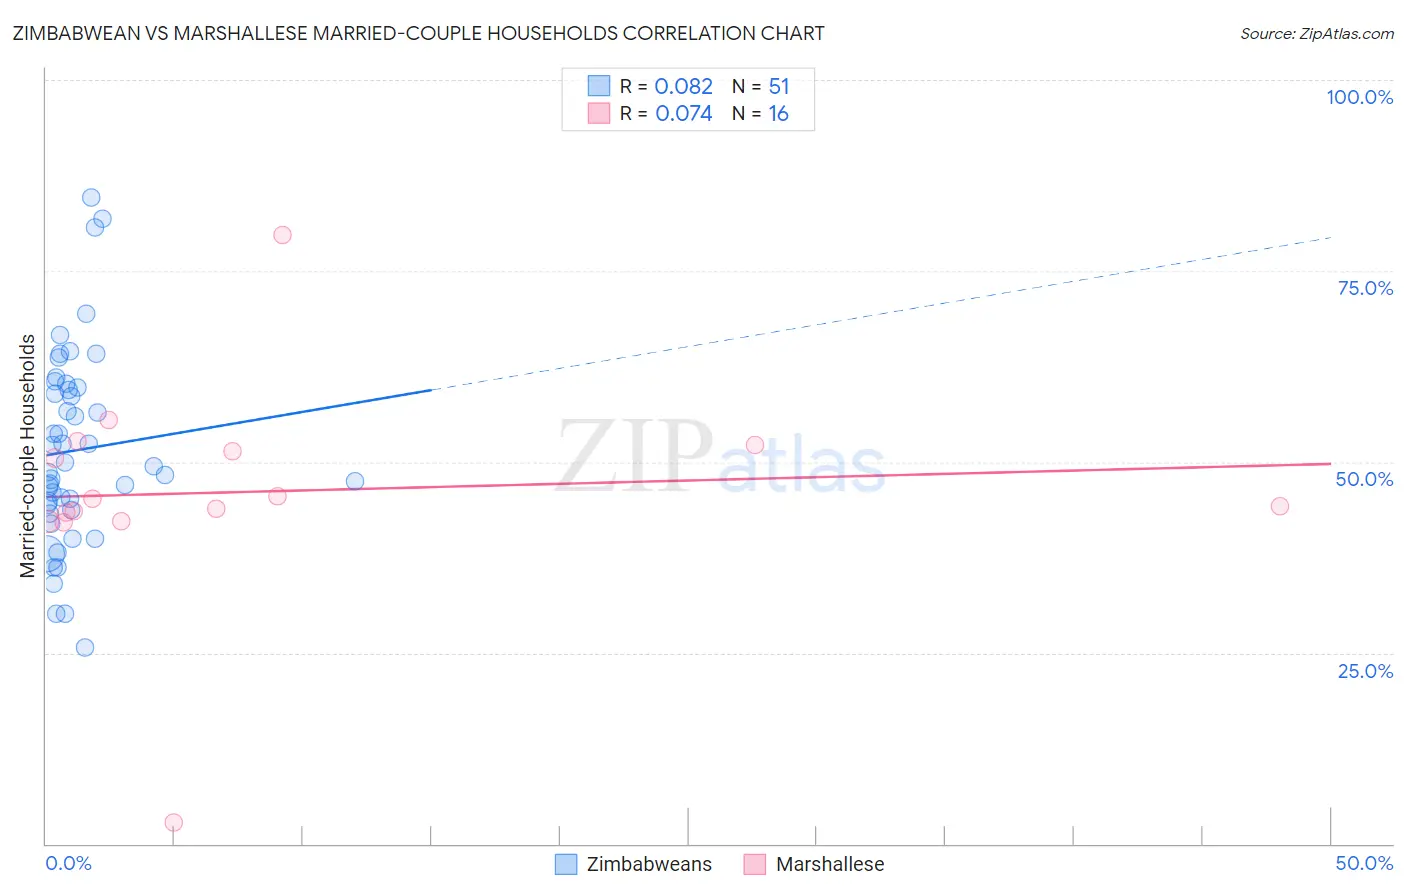
Zimbabwean vs Marshallese Married-couple Households Correlation Chart
The statistical analysis conducted on geographies consisting of 69,192,017 people shows a slight positive correlation between the proportion of Zimbabweans and percentage of married-couple family households in the United States with a correlation coefficient (R) of 0.082 and weighted average of 47.4%. Similarly, the statistical analysis conducted on geographies consisting of 14,761,315 people shows a slight positive correlation between the proportion of Marshallese and percentage of married-couple family households in the United States with a correlation coefficient (R) of 0.074 and weighted average of 44.6%, a difference of 6.1%.
Married-couple Households Correlation Summary
| Measurement | Zimbabwean | Marshallese |
| Minimum | 25.7% | 2.9% |
| Maximum | 84.6% | 79.7% |
| Range | 58.9% | 76.9% |
| Mean | 51.5% | 46.1% |
| Median | 49.5% | 44.7% |
| Interquartile 25% (IQ1) | 43.8% | 42.8% |
| Interquartile 75% (IQ3) | 59.8% | 51.8% |
| Interquartile Range (IQR) | 16.0% | 9.0% |
| Standard Deviation (Sample) | 12.8% | 14.8% |
| Standard Deviation (Population) | 12.6% | 14.3% |
Similar Demographics by Married-couple Households
Demographics Similar to Zimbabweans by Married-couple Households
In terms of married-couple households, the demographic groups most similar to Zimbabweans are Immigrants from Venezuela (47.4%, a difference of 0.010%), Australian (47.4%, a difference of 0.020%), Pakistani (47.3%, a difference of 0.050%), Okinawan (47.4%, a difference of 0.090%), and Celtic (47.3%, a difference of 0.10%).
| Demographics | Rating | Rank | Married-couple Households |
| French Canadians | 92.4 /100 | #117 | Exceptional 47.5% |
| Immigrants | Germany | 92.4 /100 | #118 | Exceptional 47.5% |
| Chileans | 92.2 /100 | #119 | Exceptional 47.5% |
| Puget Sound Salish | 90.5 /100 | #120 | Exceptional 47.4% |
| Immigrants | Eastern Europe | 90.3 /100 | #121 | Exceptional 47.4% |
| Okinawans | 90.1 /100 | #122 | Exceptional 47.4% |
| Immigrants | Venezuela | 89.3 /100 | #123 | Excellent 47.4% |
| Zimbabweans | 89.2 /100 | #124 | Excellent 47.4% |
| Australians | 89.0 /100 | #125 | Excellent 47.4% |
| Pakistanis | 88.6 /100 | #126 | Excellent 47.3% |
| Celtics | 88.1 /100 | #127 | Excellent 47.3% |
| Immigrants | Peru | 87.9 /100 | #128 | Excellent 47.3% |
| Immigrants | Iraq | 87.8 /100 | #129 | Excellent 47.3% |
| Immigrants | Hungary | 87.8 /100 | #130 | Excellent 47.3% |
| Immigrants | Denmark | 87.5 /100 | #131 | Excellent 47.3% |
Demographics Similar to Marshallese by Married-couple Households
In terms of married-couple households, the demographic groups most similar to Marshallese are Houma (44.6%, a difference of 0.0%), Soviet Union (44.6%, a difference of 0.010%), Immigrants from Uganda (44.6%, a difference of 0.040%), Immigrants from Latin America (44.7%, a difference of 0.050%), and Kenyan (44.7%, a difference of 0.10%).
| Demographics | Rating | Rank | Married-couple Households |
| Dutch West Indians | 2.6 /100 | #225 | Tragic 44.9% |
| Alsatians | 2.3 /100 | #226 | Tragic 44.8% |
| Salvadorans | 1.9 /100 | #227 | Tragic 44.7% |
| Kenyans | 1.7 /100 | #228 | Tragic 44.7% |
| Immigrants | Latin America | 1.6 /100 | #229 | Tragic 44.7% |
| Soviet Union | 1.6 /100 | #230 | Tragic 44.6% |
| Houma | 1.5 /100 | #231 | Tragic 44.6% |
| Marshallese | 1.5 /100 | #232 | Tragic 44.6% |
| Immigrants | Uganda | 1.5 /100 | #233 | Tragic 44.6% |
| Immigrants | Panama | 1.3 /100 | #234 | Tragic 44.6% |
| Immigrants | Nicaragua | 1.2 /100 | #235 | Tragic 44.5% |
| Yaqui | 1.2 /100 | #236 | Tragic 44.5% |
| Comanche | 1.2 /100 | #237 | Tragic 44.5% |
| Immigrants | Uruguay | 1.1 /100 | #238 | Tragic 44.5% |
| Spanish Americans | 1.1 /100 | #239 | Tragic 44.5% |