Basque vs Immigrants from Micronesia Married-couple Households
COMPARE
Basque
Immigrants from Micronesia
Married-couple Households
Married-couple Households Comparison
Basques
Immigrants from Micronesia
48.4%
MARRIED-COUPLE HOUSEHOLDS
99.0/ 100
METRIC RATING
63rd/ 347
METRIC RANK
44.9%
MARRIED-COUPLE HOUSEHOLDS
2.6/ 100
METRIC RATING
224th/ 347
METRIC RANK
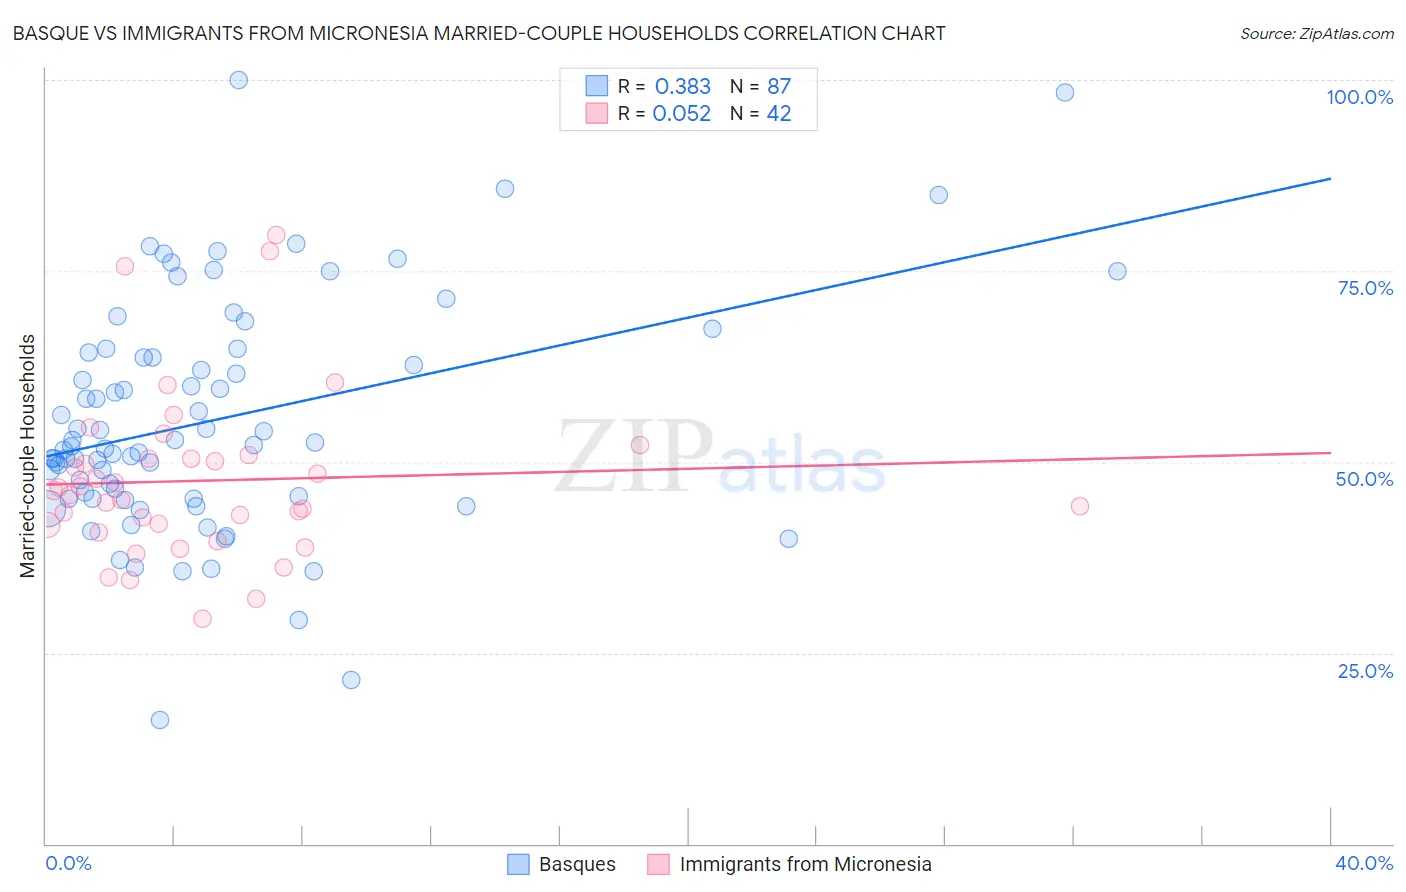
Basque vs Immigrants from Micronesia Married-couple Households Correlation Chart
The statistical analysis conducted on geographies consisting of 165,752,424 people shows a mild positive correlation between the proportion of Basques and percentage of married-couple family households in the United States with a correlation coefficient (R) of 0.383 and weighted average of 48.4%. Similarly, the statistical analysis conducted on geographies consisting of 61,600,267 people shows a slight positive correlation between the proportion of Immigrants from Micronesia and percentage of married-couple family households in the United States with a correlation coefficient (R) of 0.052 and weighted average of 44.9%, a difference of 8.0%.
Married-couple Households Correlation Summary
| Measurement | Basque | Immigrants from Micronesia |
| Minimum | 16.3% | 29.5% |
| Maximum | 100.0% | 79.7% |
| Range | 83.7% | 50.3% |
| Mean | 55.5% | 47.5% |
| Median | 52.2% | 45.9% |
| Interquartile 25% (IQ1) | 45.2% | 41.7% |
| Interquartile 75% (IQ3) | 64.3% | 50.4% |
| Interquartile Range (IQR) | 19.1% | 8.7% |
| Standard Deviation (Sample) | 15.2% | 10.9% |
| Standard Deviation (Population) | 15.1% | 10.7% |
Similar Demographics by Married-couple Households
Demographics Similar to Basques by Married-couple Households
In terms of married-couple households, the demographic groups most similar to Basques are Northern European (48.4%, a difference of 0.010%), Immigrants from Canada (48.4%, a difference of 0.030%), Jordanian (48.4%, a difference of 0.050%), Luxembourger (48.5%, a difference of 0.060%), and Romanian (48.4%, a difference of 0.060%).
| Demographics | Rating | Rank | Married-couple Households |
| Immigrants | Northern Europe | 99.3 /100 | #56 | Exceptional 48.6% |
| Poles | 99.2 /100 | #57 | Exceptional 48.5% |
| Immigrants | Indonesia | 99.2 /100 | #58 | Exceptional 48.5% |
| Czechoslovakians | 99.2 /100 | #59 | Exceptional 48.5% |
| Croatians | 99.1 /100 | #60 | Exceptional 48.5% |
| Bulgarians | 99.1 /100 | #61 | Exceptional 48.5% |
| Luxembourgers | 99.1 /100 | #62 | Exceptional 48.5% |
| Basques | 99.0 /100 | #63 | Exceptional 48.4% |
| Northern Europeans | 99.0 /100 | #64 | Exceptional 48.4% |
| Immigrants | Canada | 99.0 /100 | #65 | Exceptional 48.4% |
| Jordanians | 98.9 /100 | #66 | Exceptional 48.4% |
| Romanians | 98.9 /100 | #67 | Exceptional 48.4% |
| Immigrants | South Eastern Asia | 98.9 /100 | #68 | Exceptional 48.4% |
| Immigrants | China | 98.9 /100 | #69 | Exceptional 48.4% |
| Immigrants | North America | 98.9 /100 | #70 | Exceptional 48.4% |
Demographics Similar to Immigrants from Micronesia by Married-couple Households
In terms of married-couple households, the demographic groups most similar to Immigrants from Micronesia are Dutch West Indian (44.9%, a difference of 0.020%), Immigrants from Cambodia (44.9%, a difference of 0.030%), Alsatian (44.8%, a difference of 0.12%), Salvadoran (44.7%, a difference of 0.31%), and Kenyan (44.7%, a difference of 0.43%).
| Demographics | Rating | Rank | Married-couple Households |
| Panamanians | 5.5 /100 | #217 | Tragic 45.2% |
| Immigrants | Azores | 5.3 /100 | #218 | Tragic 45.2% |
| Nicaraguans | 5.3 /100 | #219 | Tragic 45.2% |
| Immigrants | Thailand | 5.1 /100 | #220 | Tragic 45.2% |
| Tlingit-Haida | 4.9 /100 | #221 | Tragic 45.1% |
| Immigrants | Laos | 4.6 /100 | #222 | Tragic 45.1% |
| Immigrants | Cambodia | 2.7 /100 | #223 | Tragic 44.9% |
| Immigrants | Micronesia | 2.6 /100 | #224 | Tragic 44.9% |
| Dutch West Indians | 2.6 /100 | #225 | Tragic 44.9% |
| Alsatians | 2.3 /100 | #226 | Tragic 44.8% |
| Salvadorans | 1.9 /100 | #227 | Tragic 44.7% |
| Kenyans | 1.7 /100 | #228 | Tragic 44.7% |
| Immigrants | Latin America | 1.6 /100 | #229 | Tragic 44.7% |
| Soviet Union | 1.6 /100 | #230 | Tragic 44.6% |
| Houma | 1.5 /100 | #231 | Tragic 44.6% |