Ugandan vs Chinese Births to Unmarried Women
COMPARE
Ugandan
Chinese
Births to Unmarried Women
Births to Unmarried Women Comparison
Ugandans
Chinese
30.1%
BIRTHS TO UNMARRIED WOMEN
89.2/ 100
METRIC RATING
120th/ 347
METRIC RANK
30.2%
BIRTHS TO UNMARRIED WOMEN
87.1/ 100
METRIC RATING
127th/ 347
METRIC RANK
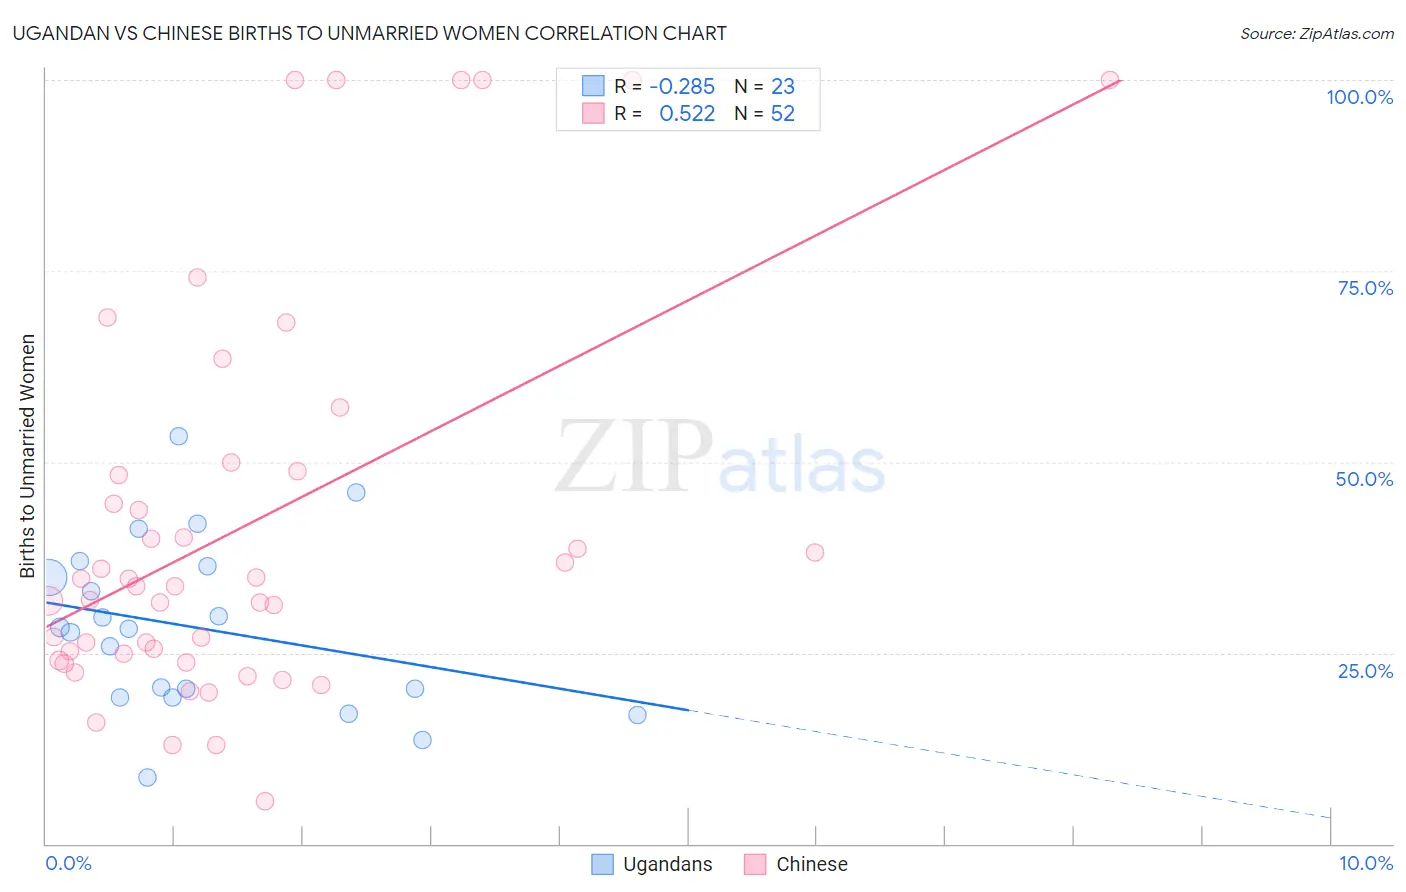
Ugandan vs Chinese Births to Unmarried Women Correlation Chart
The statistical analysis conducted on geographies consisting of 92,593,945 people shows a weak negative correlation between the proportion of Ugandans and percentage of births to unmarried women in the United States with a correlation coefficient (R) of -0.285 and weighted average of 30.1%. Similarly, the statistical analysis conducted on geographies consisting of 63,513,648 people shows a substantial positive correlation between the proportion of Chinese and percentage of births to unmarried women in the United States with a correlation coefficient (R) of 0.522 and weighted average of 30.2%, a difference of 0.50%.
Births to Unmarried Women Correlation Summary
| Measurement | Ugandan | Chinese |
| Minimum | 8.7% | 5.5% |
| Maximum | 53.4% | 100.0% |
| Range | 44.7% | 94.5% |
| Mean | 28.2% | 41.4% |
| Median | 28.1% | 33.7% |
| Interquartile 25% (IQ1) | 19.1% | 24.5% |
| Interquartile 75% (IQ3) | 36.4% | 48.5% |
| Interquartile Range (IQR) | 17.3% | 24.0% |
| Standard Deviation (Sample) | 11.1% | 25.6% |
| Standard Deviation (Population) | 10.9% | 25.4% |
Demographics Similar to Ugandans and Chinese by Births to Unmarried Women
In terms of births to unmarried women, the demographic groups most similar to Ugandans are Korean (30.1%, a difference of 0.070%), Immigrants from Argentina (30.1%, a difference of 0.12%), Syrian (30.2%, a difference of 0.25%), Croatian (30.2%, a difference of 0.29%), and Argentinean (30.0%, a difference of 0.36%). Similarly, the demographic groups most similar to Chinese are European (30.2%, a difference of 0.030%), Vietnamese (30.2%, a difference of 0.14%), Croatian (30.2%, a difference of 0.22%), Icelander (30.3%, a difference of 0.24%), and Syrian (30.2%, a difference of 0.25%).
| Demographics | Rating | Rank | Births to Unmarried Women |
| Scandinavians | 92.7 /100 | #113 | Exceptional 29.8% |
| Immigrants | Croatia | 92.6 /100 | #114 | Exceptional 29.8% |
| Ethiopians | 91.9 /100 | #115 | Exceptional 29.8% |
| Immigrants | Italy | 91.7 /100 | #116 | Exceptional 29.9% |
| Immigrants | Netherlands | 91.1 /100 | #117 | Exceptional 29.9% |
| Immigrants | Norway | 91.0 /100 | #118 | Exceptional 29.9% |
| Argentineans | 90.5 /100 | #119 | Exceptional 30.0% |
| Ugandans | 89.2 /100 | #120 | Excellent 30.1% |
| Koreans | 88.9 /100 | #121 | Excellent 30.1% |
| Immigrants | Argentina | 88.7 /100 | #122 | Excellent 30.1% |
| Syrians | 88.2 /100 | #123 | Excellent 30.2% |
| Croatians | 88.0 /100 | #124 | Excellent 30.2% |
| Vietnamese | 87.7 /100 | #125 | Excellent 30.2% |
| Europeans | 87.2 /100 | #126 | Excellent 30.2% |
| Chinese | 87.1 /100 | #127 | Excellent 30.2% |
| Icelanders | 86.0 /100 | #128 | Excellent 30.3% |
| Immigrants | Spain | 85.8 /100 | #129 | Excellent 30.3% |
| Immigrants | Bosnia and Herzegovina | 85.7 /100 | #130 | Excellent 30.3% |
| Immigrants | Zimbabwe | 85.7 /100 | #131 | Excellent 30.3% |
| New Zealanders | 85.5 /100 | #132 | Excellent 30.3% |
| Immigrants | Morocco | 85.2 /100 | #133 | Excellent 30.4% |