Ugandan vs Belizean Births to Unmarried Women
COMPARE
Ugandan
Belizean
Births to Unmarried Women
Births to Unmarried Women Comparison
Ugandans
Belizeans
30.1%
BIRTHS TO UNMARRIED WOMEN
89.2/ 100
METRIC RATING
120th/ 347
METRIC RANK
37.0%
BIRTHS TO UNMARRIED WOMEN
0.1/ 100
METRIC RATING
276th/ 347
METRIC RANK
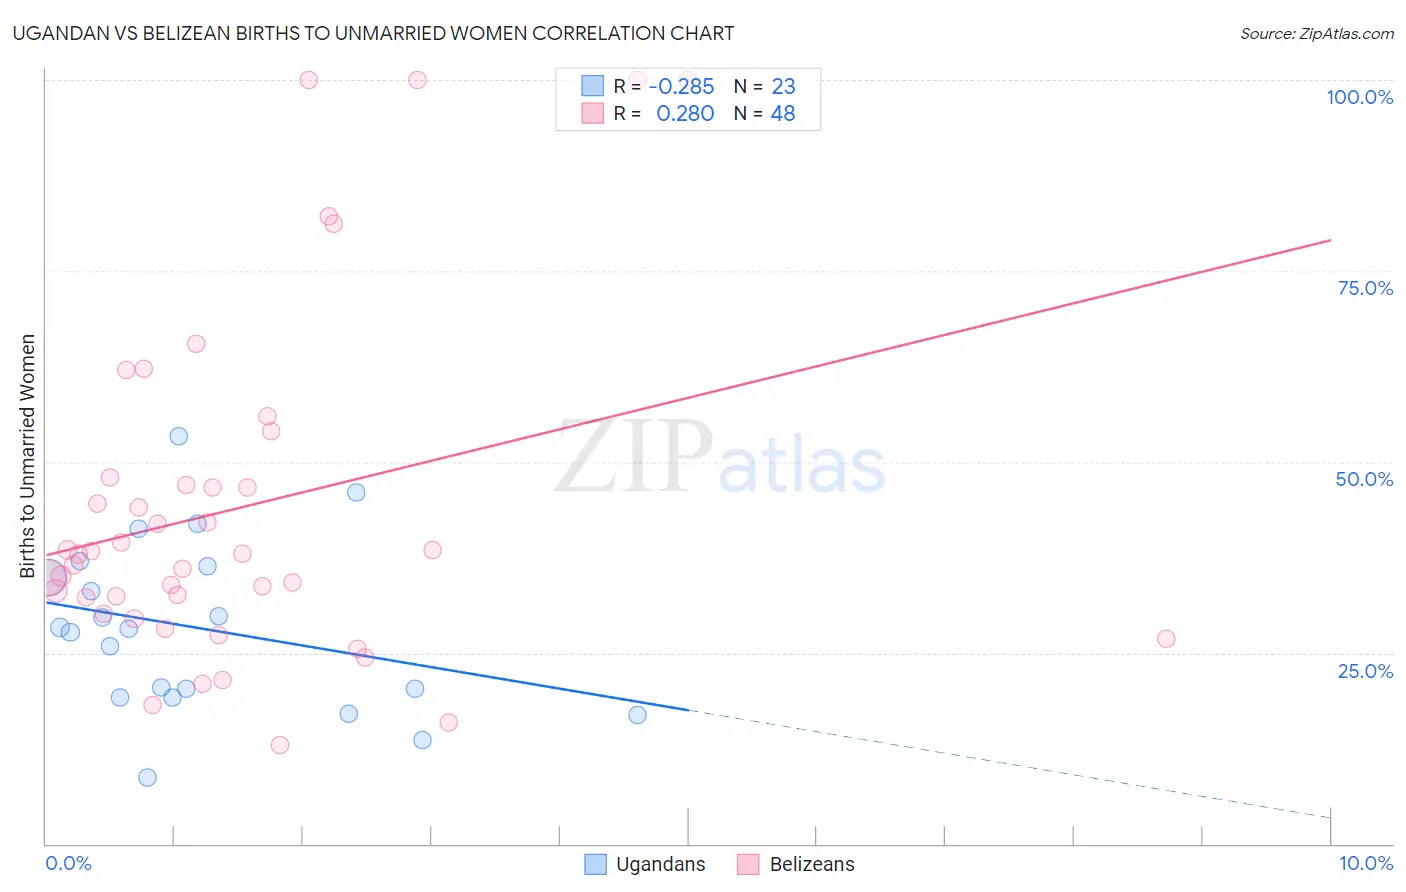
Ugandan vs Belizean Births to Unmarried Women Correlation Chart
The statistical analysis conducted on geographies consisting of 92,593,945 people shows a weak negative correlation between the proportion of Ugandans and percentage of births to unmarried women in the United States with a correlation coefficient (R) of -0.285 and weighted average of 30.1%. Similarly, the statistical analysis conducted on geographies consisting of 141,847,597 people shows a weak positive correlation between the proportion of Belizeans and percentage of births to unmarried women in the United States with a correlation coefficient (R) of 0.280 and weighted average of 37.0%, a difference of 23.1%.
Births to Unmarried Women Correlation Summary
| Measurement | Ugandan | Belizean |
| Minimum | 8.7% | 13.0% |
| Maximum | 53.4% | 100.0% |
| Range | 44.7% | 87.0% |
| Mean | 28.2% | 44.0% |
| Median | 28.1% | 38.0% |
| Interquartile 25% (IQ1) | 19.1% | 31.1% |
| Interquartile 75% (IQ3) | 36.4% | 47.5% |
| Interquartile Range (IQR) | 17.3% | 16.3% |
| Standard Deviation (Sample) | 11.1% | 22.4% |
| Standard Deviation (Population) | 10.9% | 22.1% |
Similar Demographics by Births to Unmarried Women
Demographics Similar to Ugandans by Births to Unmarried Women
In terms of births to unmarried women, the demographic groups most similar to Ugandans are Korean (30.1%, a difference of 0.070%), Immigrants from Argentina (30.1%, a difference of 0.12%), Syrian (30.2%, a difference of 0.25%), Croatian (30.2%, a difference of 0.29%), and Argentinean (30.0%, a difference of 0.36%).
| Demographics | Rating | Rank | Births to Unmarried Women |
| Scandinavians | 92.7 /100 | #113 | Exceptional 29.8% |
| Immigrants | Croatia | 92.6 /100 | #114 | Exceptional 29.8% |
| Ethiopians | 91.9 /100 | #115 | Exceptional 29.8% |
| Immigrants | Italy | 91.7 /100 | #116 | Exceptional 29.9% |
| Immigrants | Netherlands | 91.1 /100 | #117 | Exceptional 29.9% |
| Immigrants | Norway | 91.0 /100 | #118 | Exceptional 29.9% |
| Argentineans | 90.5 /100 | #119 | Exceptional 30.0% |
| Ugandans | 89.2 /100 | #120 | Excellent 30.1% |
| Koreans | 88.9 /100 | #121 | Excellent 30.1% |
| Immigrants | Argentina | 88.7 /100 | #122 | Excellent 30.1% |
| Syrians | 88.2 /100 | #123 | Excellent 30.2% |
| Croatians | 88.0 /100 | #124 | Excellent 30.2% |
| Vietnamese | 87.7 /100 | #125 | Excellent 30.2% |
| Europeans | 87.2 /100 | #126 | Excellent 30.2% |
| Chinese | 87.1 /100 | #127 | Excellent 30.2% |
Demographics Similar to Belizeans by Births to Unmarried Women
In terms of births to unmarried women, the demographic groups most similar to Belizeans are Barbadian (37.0%, a difference of 0.19%), Cree (37.0%, a difference of 0.22%), Guatemalan (37.1%, a difference of 0.22%), Immigrants from Latin America (37.1%, a difference of 0.30%), and Mexican (36.9%, a difference of 0.31%).
| Demographics | Rating | Rank | Births to Unmarried Women |
| Senegalese | 0.1 /100 | #269 | Tragic 36.8% |
| Immigrants | Congo | 0.1 /100 | #270 | Tragic 36.8% |
| Immigrants | Barbados | 0.1 /100 | #271 | Tragic 36.8% |
| Choctaw | 0.1 /100 | #272 | Tragic 36.9% |
| Mexicans | 0.1 /100 | #273 | Tragic 36.9% |
| Cree | 0.1 /100 | #274 | Tragic 37.0% |
| Barbadians | 0.1 /100 | #275 | Tragic 37.0% |
| Belizeans | 0.1 /100 | #276 | Tragic 37.0% |
| Guatemalans | 0.1 /100 | #277 | Tragic 37.1% |
| Immigrants | Latin America | 0.1 /100 | #278 | Tragic 37.1% |
| West Indians | 0.1 /100 | #279 | Tragic 37.3% |
| Immigrants | St. Vincent and the Grenadines | 0.1 /100 | #280 | Tragic 37.3% |
| Immigrants | Belize | 0.1 /100 | #281 | Tragic 37.3% |
| Liberians | 0.0 /100 | #282 | Tragic 37.4% |
| Spanish American Indians | 0.0 /100 | #283 | Tragic 37.4% |