Crow vs Chinese Births to Unmarried Women
COMPARE
Crow
Chinese
Births to Unmarried Women
Births to Unmarried Women Comparison
Crow
Chinese
40.4%
BIRTHS TO UNMARRIED WOMEN
0.0/ 100
METRIC RATING
320th/ 347
METRIC RANK
30.2%
BIRTHS TO UNMARRIED WOMEN
87.1/ 100
METRIC RATING
127th/ 347
METRIC RANK
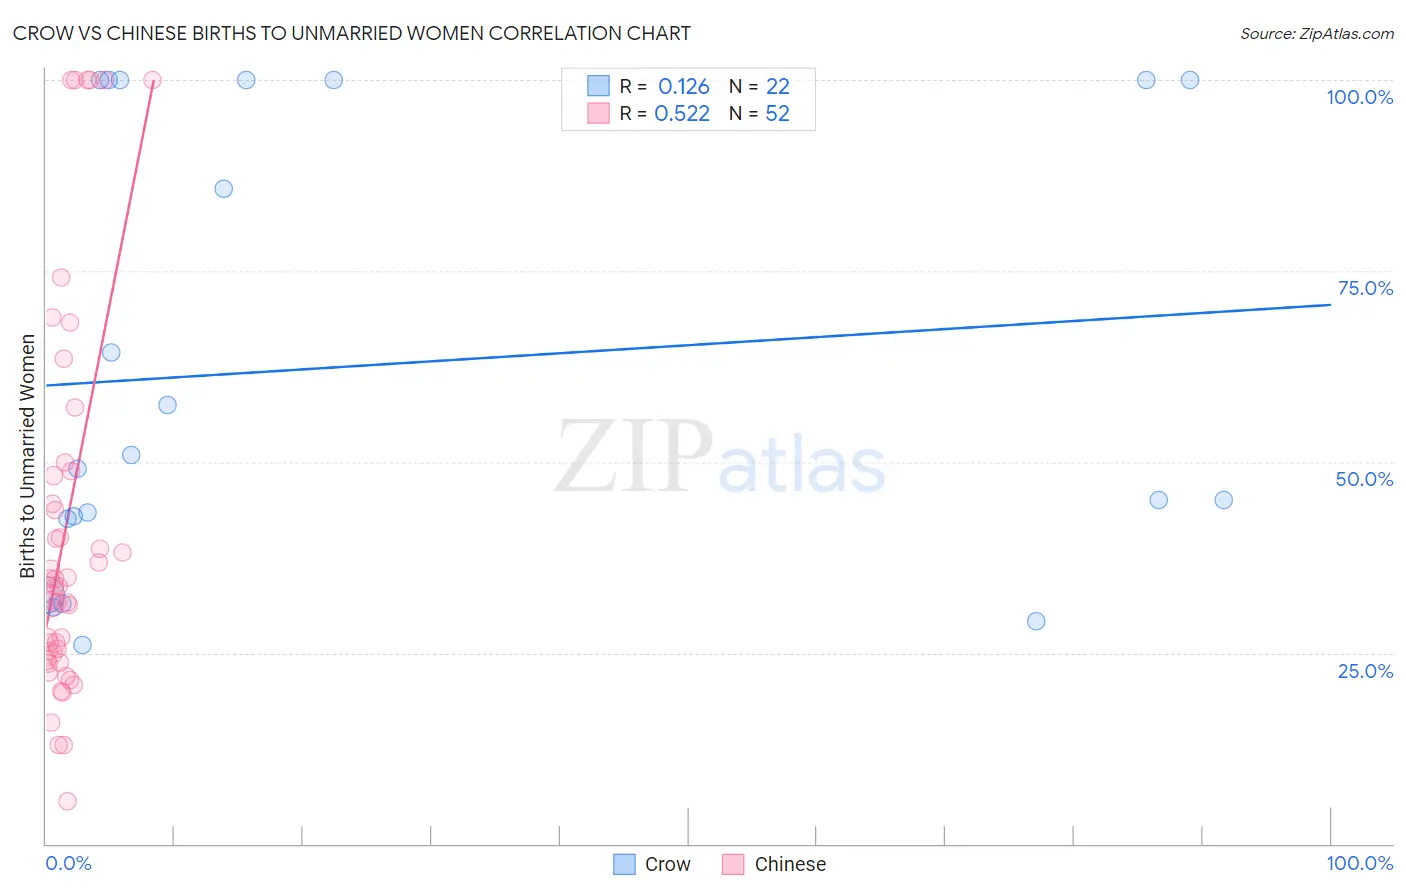
Crow vs Chinese Births to Unmarried Women Correlation Chart
The statistical analysis conducted on geographies consisting of 58,263,233 people shows a poor positive correlation between the proportion of Crow and percentage of births to unmarried women in the United States with a correlation coefficient (R) of 0.126 and weighted average of 40.4%. Similarly, the statistical analysis conducted on geographies consisting of 63,513,648 people shows a substantial positive correlation between the proportion of Chinese and percentage of births to unmarried women in the United States with a correlation coefficient (R) of 0.522 and weighted average of 30.2%, a difference of 33.5%.
Births to Unmarried Women Correlation Summary
| Measurement | Crow | Chinese |
| Minimum | 26.1% | 5.5% |
| Maximum | 100.0% | 100.0% |
| Range | 73.9% | 94.5% |
| Mean | 62.6% | 41.4% |
| Median | 50.0% | 33.7% |
| Interquartile 25% (IQ1) | 42.5% | 24.5% |
| Interquartile 75% (IQ3) | 100.0% | 48.5% |
| Interquartile Range (IQR) | 57.5% | 24.0% |
| Standard Deviation (Sample) | 29.1% | 25.6% |
| Standard Deviation (Population) | 28.4% | 25.4% |
Similar Demographics by Births to Unmarried Women
Demographics Similar to Crow by Births to Unmarried Women
In terms of births to unmarried women, the demographic groups most similar to Crow are Yakama (40.3%, a difference of 0.060%), Immigrants from Bahamas (40.1%, a difference of 0.61%), Immigrants from Dominican Republic (40.1%, a difference of 0.68%), Bahamian (40.8%, a difference of 1.0%), and Apache (39.9%, a difference of 1.2%).
| Demographics | Rating | Rank | Births to Unmarried Women |
| Africans | 0.0 /100 | #313 | Tragic 39.7% |
| Immigrants | Caribbean | 0.0 /100 | #314 | Tragic 39.8% |
| Dominicans | 0.0 /100 | #315 | Tragic 39.8% |
| Apache | 0.0 /100 | #316 | Tragic 39.9% |
| Immigrants | Dominican Republic | 0.0 /100 | #317 | Tragic 40.1% |
| Immigrants | Bahamas | 0.0 /100 | #318 | Tragic 40.1% |
| Yakama | 0.0 /100 | #319 | Tragic 40.3% |
| Crow | 0.0 /100 | #320 | Tragic 40.4% |
| Bahamians | 0.0 /100 | #321 | Tragic 40.8% |
| Cajuns | 0.0 /100 | #322 | Tragic 41.0% |
| Sioux | 0.0 /100 | #323 | Tragic 41.0% |
| Cape Verdeans | 0.0 /100 | #324 | Tragic 41.3% |
| Cheyenne | 0.0 /100 | #325 | Tragic 41.3% |
| Immigrants | Cuba | 0.0 /100 | #326 | Tragic 41.5% |
| Tsimshian | 0.0 /100 | #327 | Tragic 42.2% |
Demographics Similar to Chinese by Births to Unmarried Women
In terms of births to unmarried women, the demographic groups most similar to Chinese are European (30.2%, a difference of 0.030%), Vietnamese (30.2%, a difference of 0.14%), Croatian (30.2%, a difference of 0.22%), Icelander (30.3%, a difference of 0.24%), and Syrian (30.2%, a difference of 0.25%).
| Demographics | Rating | Rank | Births to Unmarried Women |
| Ugandans | 89.2 /100 | #120 | Excellent 30.1% |
| Koreans | 88.9 /100 | #121 | Excellent 30.1% |
| Immigrants | Argentina | 88.7 /100 | #122 | Excellent 30.1% |
| Syrians | 88.2 /100 | #123 | Excellent 30.2% |
| Croatians | 88.0 /100 | #124 | Excellent 30.2% |
| Vietnamese | 87.7 /100 | #125 | Excellent 30.2% |
| Europeans | 87.2 /100 | #126 | Excellent 30.2% |
| Chinese | 87.1 /100 | #127 | Excellent 30.2% |
| Icelanders | 86.0 /100 | #128 | Excellent 30.3% |
| Immigrants | Spain | 85.8 /100 | #129 | Excellent 30.3% |
| Immigrants | Bosnia and Herzegovina | 85.7 /100 | #130 | Excellent 30.3% |
| Immigrants | Zimbabwe | 85.7 /100 | #131 | Excellent 30.3% |
| New Zealanders | 85.5 /100 | #132 | Excellent 30.3% |
| Immigrants | Morocco | 85.2 /100 | #133 | Excellent 30.4% |
| Immigrants | South Eastern Asia | 85.2 /100 | #134 | Excellent 30.4% |