Ugandan vs Scotch-Irish Births to Unmarried Women
COMPARE
Ugandan
Scotch-Irish
Births to Unmarried Women
Births to Unmarried Women Comparison
Ugandans
Scotch-Irish
30.1%
BIRTHS TO UNMARRIED WOMEN
89.2/ 100
METRIC RATING
120th/ 347
METRIC RANK
33.3%
BIRTHS TO UNMARRIED WOMEN
10.7/ 100
METRIC RATING
210th/ 347
METRIC RANK
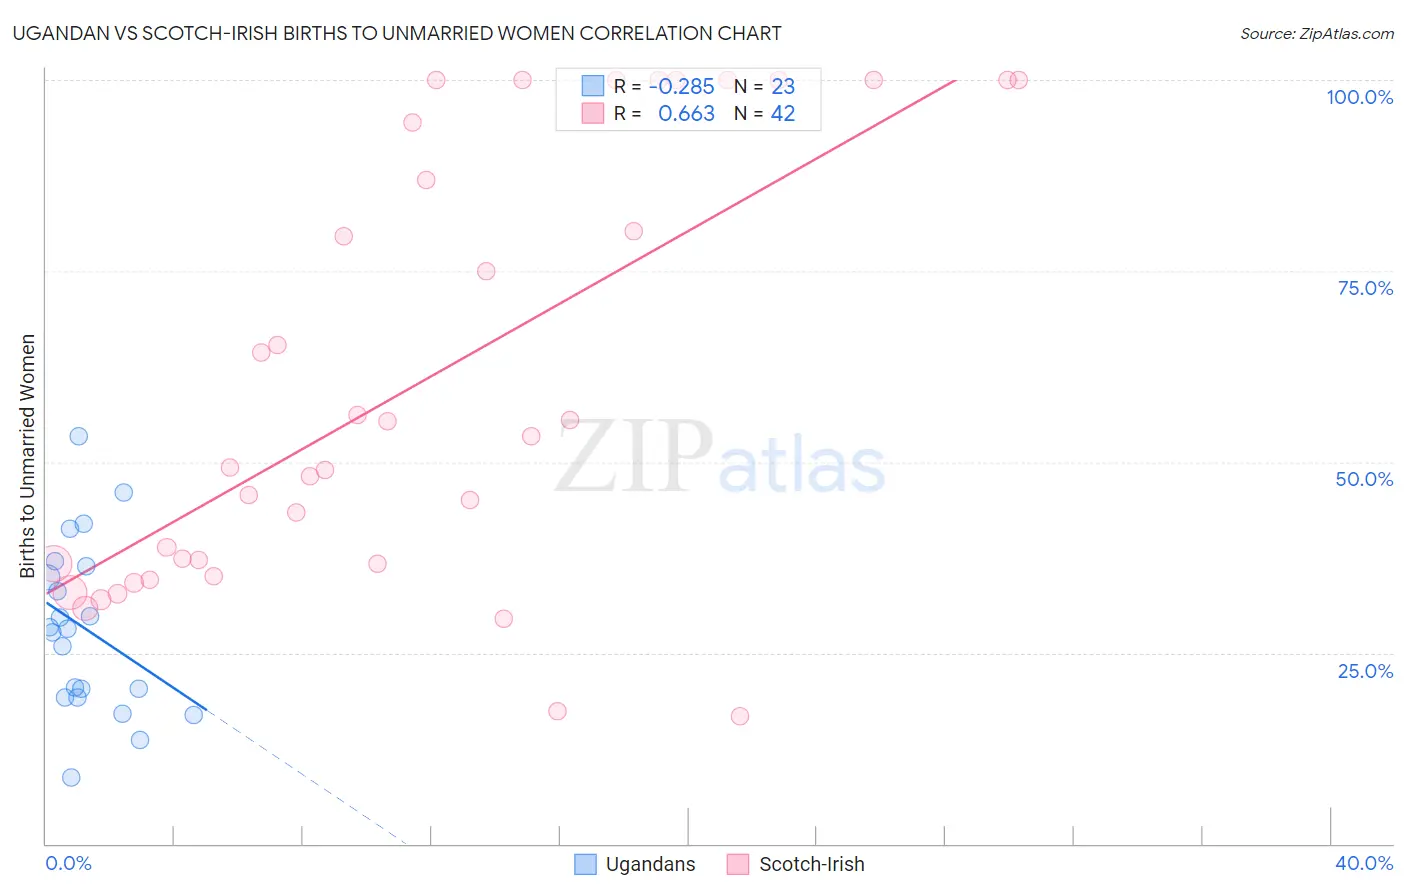
Ugandan vs Scotch-Irish Births to Unmarried Women Correlation Chart
The statistical analysis conducted on geographies consisting of 92,593,945 people shows a weak negative correlation between the proportion of Ugandans and percentage of births to unmarried women in the United States with a correlation coefficient (R) of -0.285 and weighted average of 30.1%. Similarly, the statistical analysis conducted on geographies consisting of 488,755,262 people shows a significant positive correlation between the proportion of Scotch-Irish and percentage of births to unmarried women in the United States with a correlation coefficient (R) of 0.663 and weighted average of 33.3%, a difference of 10.5%.
Births to Unmarried Women Correlation Summary
| Measurement | Ugandan | Scotch-Irish |
| Minimum | 8.7% | 16.7% |
| Maximum | 53.4% | 100.0% |
| Range | 44.7% | 83.3% |
| Mean | 28.2% | 60.2% |
| Median | 28.1% | 51.3% |
| Interquartile 25% (IQ1) | 19.1% | 36.6% |
| Interquartile 75% (IQ3) | 36.4% | 94.4% |
| Interquartile Range (IQR) | 17.3% | 57.8% |
| Standard Deviation (Sample) | 11.1% | 28.1% |
| Standard Deviation (Population) | 10.9% | 27.8% |
Similar Demographics by Births to Unmarried Women
Demographics Similar to Ugandans by Births to Unmarried Women
In terms of births to unmarried women, the demographic groups most similar to Ugandans are Korean (30.1%, a difference of 0.070%), Immigrants from Argentina (30.1%, a difference of 0.12%), Syrian (30.2%, a difference of 0.25%), Croatian (30.2%, a difference of 0.29%), and Argentinean (30.0%, a difference of 0.36%).
| Demographics | Rating | Rank | Births to Unmarried Women |
| Scandinavians | 92.7 /100 | #113 | Exceptional 29.8% |
| Immigrants | Croatia | 92.6 /100 | #114 | Exceptional 29.8% |
| Ethiopians | 91.9 /100 | #115 | Exceptional 29.8% |
| Immigrants | Italy | 91.7 /100 | #116 | Exceptional 29.9% |
| Immigrants | Netherlands | 91.1 /100 | #117 | Exceptional 29.9% |
| Immigrants | Norway | 91.0 /100 | #118 | Exceptional 29.9% |
| Argentineans | 90.5 /100 | #119 | Exceptional 30.0% |
| Ugandans | 89.2 /100 | #120 | Excellent 30.1% |
| Koreans | 88.9 /100 | #121 | Excellent 30.1% |
| Immigrants | Argentina | 88.7 /100 | #122 | Excellent 30.1% |
| Syrians | 88.2 /100 | #123 | Excellent 30.2% |
| Croatians | 88.0 /100 | #124 | Excellent 30.2% |
| Vietnamese | 87.7 /100 | #125 | Excellent 30.2% |
| Europeans | 87.2 /100 | #126 | Excellent 30.2% |
| Chinese | 87.1 /100 | #127 | Excellent 30.2% |
Demographics Similar to Scotch-Irish by Births to Unmarried Women
In terms of births to unmarried women, the demographic groups most similar to Scotch-Irish are White/Caucasian (33.3%, a difference of 0.0%), Ecuadorian (33.3%, a difference of 0.050%), Celtic (33.3%, a difference of 0.12%), Hawaiian (33.2%, a difference of 0.14%), and Immigrants from Sudan (33.2%, a difference of 0.17%).
| Demographics | Rating | Rank | Births to Unmarried Women |
| Ute | 14.4 /100 | #203 | Poor 33.0% |
| Immigrants | Africa | 14.3 /100 | #204 | Poor 33.0% |
| German Russians | 13.1 /100 | #205 | Poor 33.1% |
| Uruguayans | 12.8 /100 | #206 | Poor 33.1% |
| Immigrants | Sudan | 11.5 /100 | #207 | Poor 33.2% |
| Hawaiians | 11.3 /100 | #208 | Poor 33.2% |
| Whites/Caucasians | 10.7 /100 | #209 | Poor 33.3% |
| Scotch-Irish | 10.7 /100 | #210 | Poor 33.3% |
| Ecuadorians | 10.5 /100 | #211 | Poor 33.3% |
| Celtics | 10.2 /100 | #212 | Poor 33.3% |
| Immigrants | Costa Rica | 9.5 /100 | #213 | Tragic 33.4% |
| Slovaks | 9.3 /100 | #214 | Tragic 33.4% |
| French | 8.7 /100 | #215 | Tragic 33.4% |
| Nepalese | 7.8 /100 | #216 | Tragic 33.5% |
| Spaniards | 7.0 /100 | #217 | Tragic 33.6% |