Immigrants from Pakistan vs Chinese Births to Unmarried Women
COMPARE
Immigrants from Pakistan
Chinese
Births to Unmarried Women
Births to Unmarried Women Comparison
Immigrants from Pakistan
Chinese
27.2%
BIRTHS TO UNMARRIED WOMEN
99.8/ 100
METRIC RATING
34th/ 347
METRIC RANK
30.2%
BIRTHS TO UNMARRIED WOMEN
87.1/ 100
METRIC RATING
127th/ 347
METRIC RANK
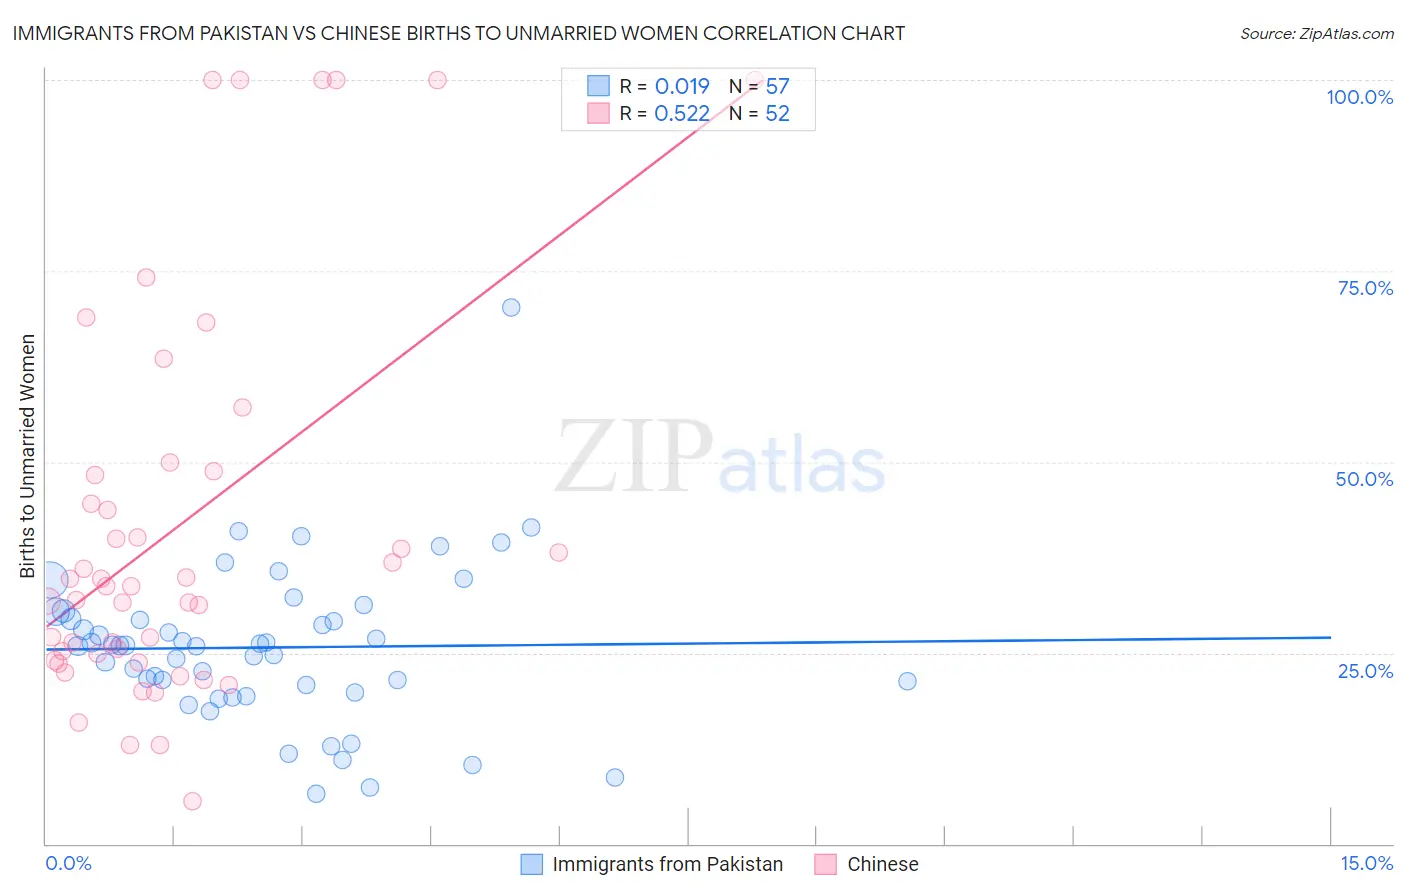
Immigrants from Pakistan vs Chinese Births to Unmarried Women Correlation Chart
The statistical analysis conducted on geographies consisting of 268,631,463 people shows no correlation between the proportion of Immigrants from Pakistan and percentage of births to unmarried women in the United States with a correlation coefficient (R) of 0.019 and weighted average of 27.2%. Similarly, the statistical analysis conducted on geographies consisting of 63,513,648 people shows a substantial positive correlation between the proportion of Chinese and percentage of births to unmarried women in the United States with a correlation coefficient (R) of 0.522 and weighted average of 30.2%, a difference of 11.3%.
Births to Unmarried Women Correlation Summary
| Measurement | Immigrants from Pakistan | Chinese |
| Minimum | 6.6% | 5.5% |
| Maximum | 70.2% | 100.0% |
| Range | 63.6% | 94.5% |
| Mean | 25.7% | 41.4% |
| Median | 26.0% | 33.7% |
| Interquartile 25% (IQ1) | 20.3% | 24.5% |
| Interquartile 75% (IQ3) | 29.9% | 48.5% |
| Interquartile Range (IQR) | 9.6% | 24.0% |
| Standard Deviation (Sample) | 10.3% | 25.6% |
| Standard Deviation (Population) | 10.3% | 25.4% |
Similar Demographics by Births to Unmarried Women
Demographics Similar to Immigrants from Pakistan by Births to Unmarried Women
In terms of births to unmarried women, the demographic groups most similar to Immigrants from Pakistan are Immigrants from Sri Lanka (27.2%, a difference of 0.040%), Immigrants from Ireland (27.2%, a difference of 0.070%), Immigrants from Russia (27.1%, a difference of 0.11%), Immigrants from Iraq (27.1%, a difference of 0.14%), and Immigrants from Western Asia (27.2%, a difference of 0.15%).
| Demographics | Rating | Rank | Births to Unmarried Women |
| Immigrants | Asia | 99.9 /100 | #27 | Exceptional 26.8% |
| Okinawans | 99.8 /100 | #28 | Exceptional 26.9% |
| Cypriots | 99.8 /100 | #29 | Exceptional 27.0% |
| Bulgarians | 99.8 /100 | #30 | Exceptional 27.1% |
| Immigrants | Iraq | 99.8 /100 | #31 | Exceptional 27.1% |
| Immigrants | Russia | 99.8 /100 | #32 | Exceptional 27.1% |
| Immigrants | Sri Lanka | 99.8 /100 | #33 | Exceptional 27.2% |
| Immigrants | Pakistan | 99.8 /100 | #34 | Exceptional 27.2% |
| Immigrants | Ireland | 99.7 /100 | #35 | Exceptional 27.2% |
| Immigrants | Western Asia | 99.7 /100 | #36 | Exceptional 27.2% |
| Immigrants | Ukraine | 99.7 /100 | #37 | Exceptional 27.2% |
| Immigrants | Moldova | 99.7 /100 | #38 | Exceptional 27.3% |
| Immigrants | Malaysia | 99.7 /100 | #39 | Exceptional 27.4% |
| Turks | 99.6 /100 | #40 | Exceptional 27.4% |
| Iraqis | 99.6 /100 | #41 | Exceptional 27.6% |
Demographics Similar to Chinese by Births to Unmarried Women
In terms of births to unmarried women, the demographic groups most similar to Chinese are European (30.2%, a difference of 0.030%), Vietnamese (30.2%, a difference of 0.14%), Croatian (30.2%, a difference of 0.22%), Icelander (30.3%, a difference of 0.24%), and Syrian (30.2%, a difference of 0.25%).
| Demographics | Rating | Rank | Births to Unmarried Women |
| Ugandans | 89.2 /100 | #120 | Excellent 30.1% |
| Koreans | 88.9 /100 | #121 | Excellent 30.1% |
| Immigrants | Argentina | 88.7 /100 | #122 | Excellent 30.1% |
| Syrians | 88.2 /100 | #123 | Excellent 30.2% |
| Croatians | 88.0 /100 | #124 | Excellent 30.2% |
| Vietnamese | 87.7 /100 | #125 | Excellent 30.2% |
| Europeans | 87.2 /100 | #126 | Excellent 30.2% |
| Chinese | 87.1 /100 | #127 | Excellent 30.2% |
| Icelanders | 86.0 /100 | #128 | Excellent 30.3% |
| Immigrants | Spain | 85.8 /100 | #129 | Excellent 30.3% |
| Immigrants | Bosnia and Herzegovina | 85.7 /100 | #130 | Excellent 30.3% |
| Immigrants | Zimbabwe | 85.7 /100 | #131 | Excellent 30.3% |
| New Zealanders | 85.5 /100 | #132 | Excellent 30.3% |
| Immigrants | Morocco | 85.2 /100 | #133 | Excellent 30.4% |
| Immigrants | South Eastern Asia | 85.2 /100 | #134 | Excellent 30.4% |