Turkish vs Immigrants from Sudan Householder Income Over 65 years
COMPARE
Turkish
Immigrants from Sudan
Householder Income Over 65 years
Householder Income Over 65 years Comparison
Turks
Immigrants from Sudan
$68,037
HOUSEHOLDER INCOME OVER 65 YEARS
99.9/ 100
METRIC RATING
37th/ 347
METRIC RANK
$59,248
HOUSEHOLDER INCOME OVER 65 YEARS
14.2/ 100
METRIC RATING
205th/ 347
METRIC RANK
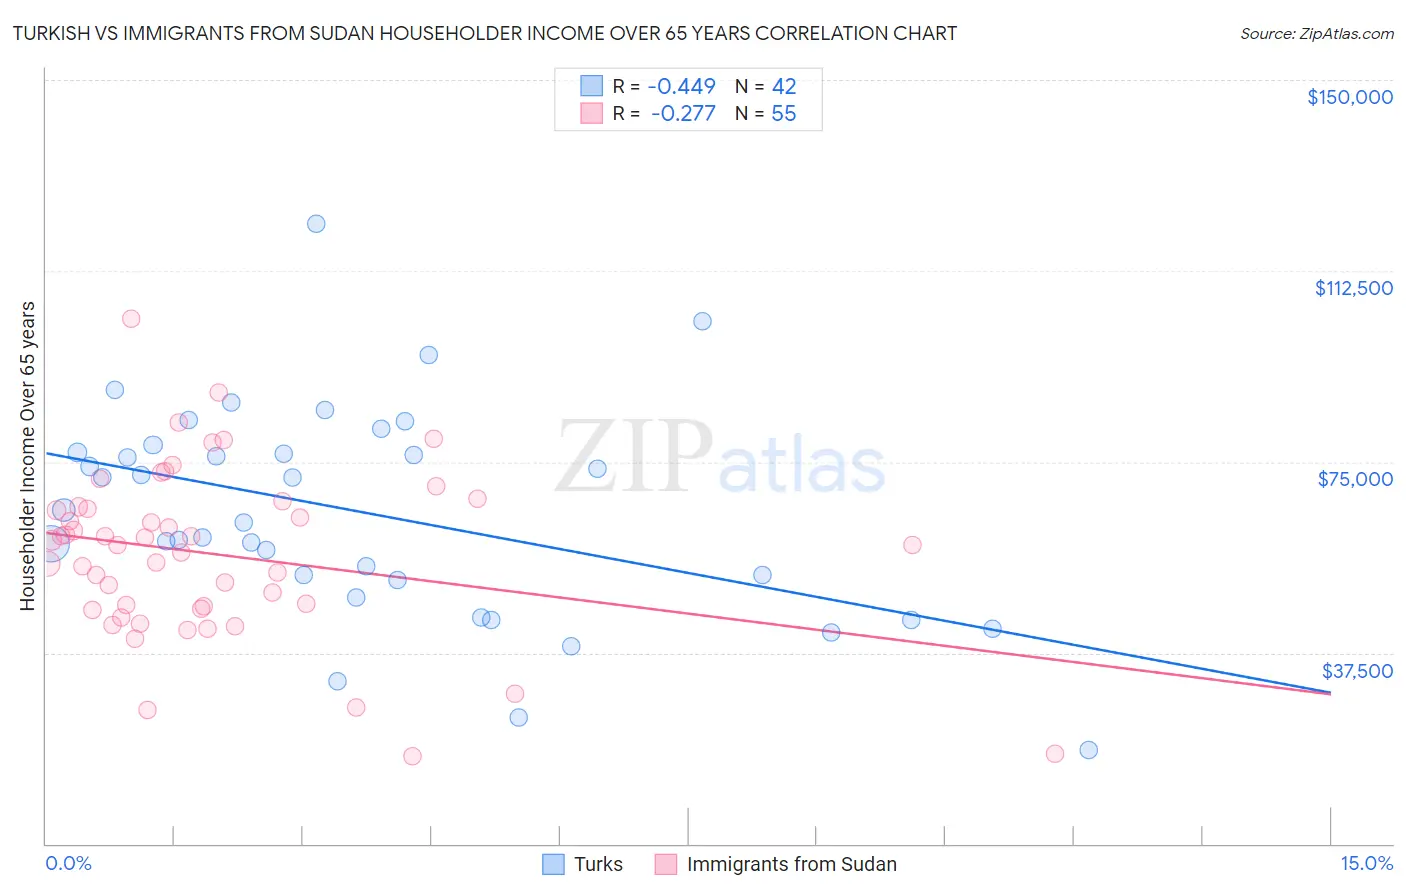
Turkish vs Immigrants from Sudan Householder Income Over 65 years Correlation Chart
The statistical analysis conducted on geographies consisting of 271,295,449 people shows a moderate negative correlation between the proportion of Turks and household income with householder over the age of 65 in the United States with a correlation coefficient (R) of -0.449 and weighted average of $68,037. Similarly, the statistical analysis conducted on geographies consisting of 118,852,154 people shows a weak negative correlation between the proportion of Immigrants from Sudan and household income with householder over the age of 65 in the United States with a correlation coefficient (R) of -0.277 and weighted average of $59,248, a difference of 14.8%.
Householder Income Over 65 years Correlation Summary
| Measurement | Turkish | Immigrants from Sudan |
| Minimum | $18,472 | $17,083 |
| Maximum | $121,806 | $103,228 |
| Range | $103,334 | $86,145 |
| Mean | $64,935 | $56,870 |
| Median | $64,229 | $58,750 |
| Interquartile 25% (IQ1) | $51,875 | $46,141 |
| Interquartile 75% (IQ3) | $76,840 | $66,178 |
| Interquartile Range (IQR) | $24,964 | $20,037 |
| Standard Deviation (Sample) | $21,025 | $16,735 |
| Standard Deviation (Population) | $20,773 | $16,583 |
Similar Demographics by Householder Income Over 65 years
Demographics Similar to Turks by Householder Income Over 65 years
In terms of householder income over 65 years, the demographic groups most similar to Turks are Estonian ($67,926, a difference of 0.16%), Immigrants from Austria ($68,208, a difference of 0.25%), Tongan ($68,235, a difference of 0.29%), Russian ($67,626, a difference of 0.61%), and Immigrants from Asia ($67,594, a difference of 0.66%).
| Demographics | Rating | Rank | Householder Income Over 65 years |
| Immigrants | Northern Europe | 100.0 /100 | #30 | Exceptional $69,003 |
| Afghans | 100.0 /100 | #31 | Exceptional $68,951 |
| Asians | 100.0 /100 | #32 | Exceptional $68,822 |
| Immigrants | Denmark | 100.0 /100 | #33 | Exceptional $68,801 |
| Immigrants | Ireland | 100.0 /100 | #34 | Exceptional $68,495 |
| Tongans | 100.0 /100 | #35 | Exceptional $68,235 |
| Immigrants | Austria | 99.9 /100 | #36 | Exceptional $68,208 |
| Turks | 99.9 /100 | #37 | Exceptional $68,037 |
| Estonians | 99.9 /100 | #38 | Exceptional $67,926 |
| Russians | 99.9 /100 | #39 | Exceptional $67,626 |
| Immigrants | Asia | 99.9 /100 | #40 | Exceptional $67,594 |
| Koreans | 99.9 /100 | #41 | Exceptional $67,472 |
| New Zealanders | 99.9 /100 | #42 | Exceptional $67,333 |
| Latvians | 99.9 /100 | #43 | Exceptional $67,326 |
| Immigrants | South Africa | 99.9 /100 | #44 | Exceptional $67,234 |
Demographics Similar to Immigrants from Sudan by Householder Income Over 65 years
In terms of householder income over 65 years, the demographic groups most similar to Immigrants from Sudan are Immigrants from South America ($59,151, a difference of 0.16%), Salvadoran ($59,141, a difference of 0.18%), Arapaho ($59,383, a difference of 0.23%), Uruguayan ($59,090, a difference of 0.27%), and Scotch-Irish ($59,447, a difference of 0.34%).
| Demographics | Rating | Rank | Householder Income Over 65 years |
| Moroccans | 20.7 /100 | #198 | Fair $59,683 |
| Immigrants | Immigrants | 20.2 /100 | #199 | Fair $59,656 |
| French | 20.2 /100 | #200 | Fair $59,656 |
| Dutch | 18.3 /100 | #201 | Poor $59,539 |
| Finns | 18.2 /100 | #202 | Poor $59,535 |
| Scotch-Irish | 16.9 /100 | #203 | Poor $59,447 |
| Arapaho | 16.0 /100 | #204 | Poor $59,383 |
| Immigrants | Sudan | 14.2 /100 | #205 | Poor $59,248 |
| Immigrants | South America | 13.0 /100 | #206 | Poor $59,151 |
| Salvadorans | 12.9 /100 | #207 | Poor $59,141 |
| Uruguayans | 12.3 /100 | #208 | Poor $59,090 |
| Slovaks | 11.7 /100 | #209 | Poor $59,039 |
| Nigerians | 11.2 /100 | #210 | Poor $58,992 |
| Immigrants | Nigeria | 10.7 /100 | #211 | Poor $58,942 |
| Colombians | 9.8 /100 | #212 | Tragic $58,851 |