Turkish vs Immigrants from Sudan Nursery School
COMPARE
Turkish
Immigrants from Sudan
Nursery School
Nursery School Comparison
Turks
Immigrants from Sudan
98.2%
NURSERY SCHOOL
97.4/ 100
METRIC RATING
105th/ 347
METRIC RANK
97.7%
NURSERY SCHOOL
3.9/ 100
METRIC RATING
223rd/ 347
METRIC RANK
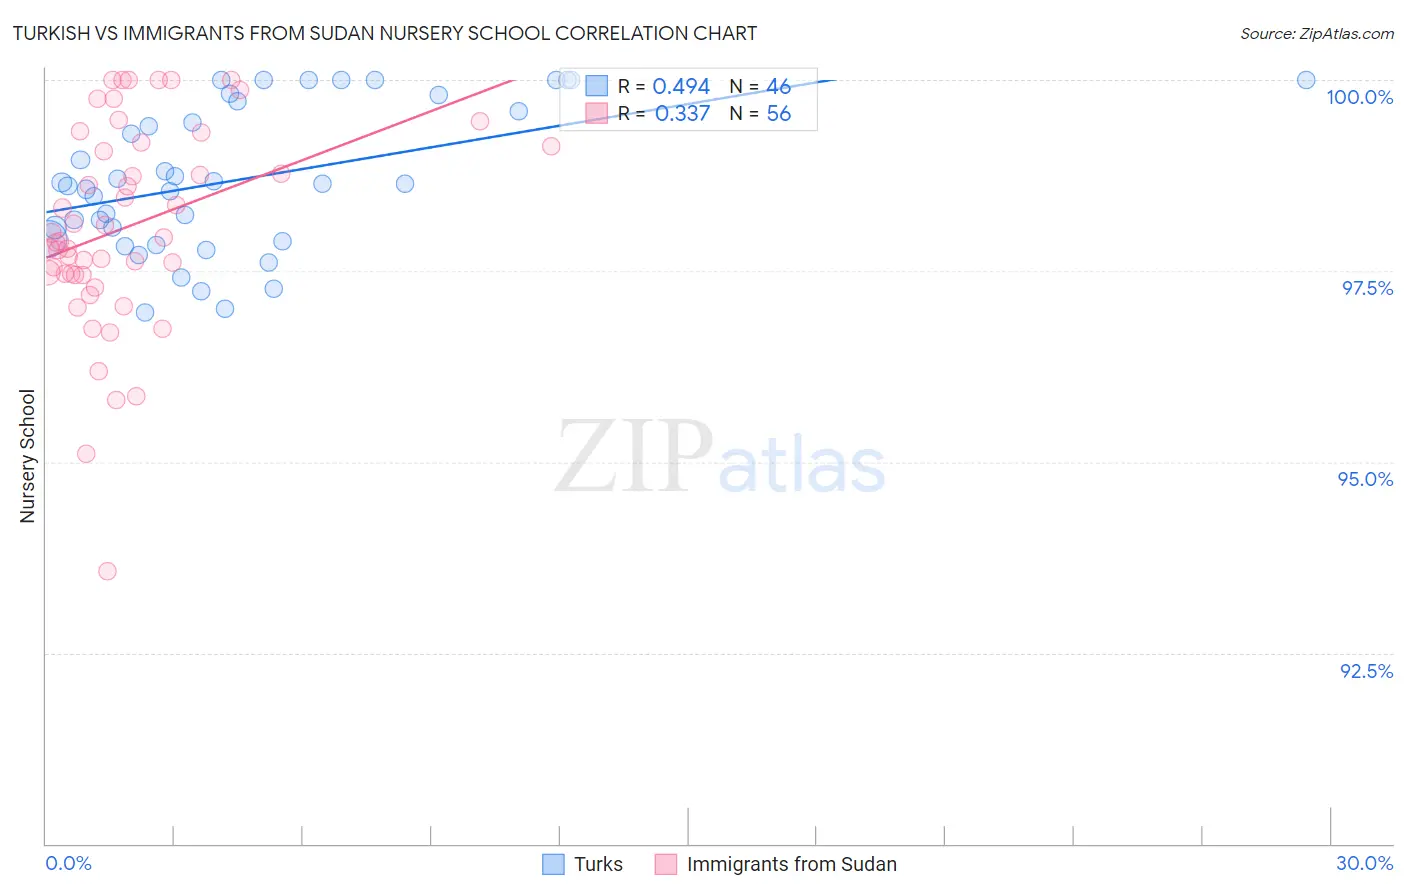
Turkish vs Immigrants from Sudan Nursery School Correlation Chart
The statistical analysis conducted on geographies consisting of 271,858,657 people shows a moderate positive correlation between the proportion of Turks and percentage of population with at least nursery school education in the United States with a correlation coefficient (R) of 0.494 and weighted average of 98.2%. Similarly, the statistical analysis conducted on geographies consisting of 118,957,985 people shows a mild positive correlation between the proportion of Immigrants from Sudan and percentage of population with at least nursery school education in the United States with a correlation coefficient (R) of 0.337 and weighted average of 97.7%, a difference of 0.51%.
Nursery School Correlation Summary
| Measurement | Turkish | Immigrants from Sudan |
| Minimum | 97.0% | 93.6% |
| Maximum | 100.0% | 100.0% |
| Range | 3.0% | 6.4% |
| Mean | 98.7% | 98.1% |
| Median | 98.6% | 97.9% |
| Interquartile 25% (IQ1) | 97.9% | 97.5% |
| Interquartile 75% (IQ3) | 99.7% | 99.2% |
| Interquartile Range (IQR) | 1.8% | 1.7% |
| Standard Deviation (Sample) | 0.95% | 1.3% |
| Standard Deviation (Population) | 0.94% | 1.3% |
Similar Demographics by Nursery School
Demographics Similar to Turks by Nursery School
In terms of nursery school, the demographic groups most similar to Turks are Bhutanese (98.2%, a difference of 0.0%), Immigrants from Switzerland (98.2%, a difference of 0.0%), Basque (98.2%, a difference of 0.0%), Immigrants from Ireland (98.3%, a difference of 0.010%), and Cree (98.3%, a difference of 0.010%).
| Demographics | Rating | Rank | Nursery School |
| Choctaw | 98.3 /100 | #98 | Exceptional 98.3% |
| Colville | 98.2 /100 | #99 | Exceptional 98.3% |
| Puget Sound Salish | 98.0 /100 | #100 | Exceptional 98.3% |
| Romanians | 97.9 /100 | #101 | Exceptional 98.3% |
| Immigrants | Ireland | 97.7 /100 | #102 | Exceptional 98.3% |
| Cree | 97.7 /100 | #103 | Exceptional 98.3% |
| Bhutanese | 97.4 /100 | #104 | Exceptional 98.2% |
| Turks | 97.4 /100 | #105 | Exceptional 98.2% |
| Immigrants | Switzerland | 97.3 /100 | #106 | Exceptional 98.2% |
| Basques | 97.3 /100 | #107 | Exceptional 98.2% |
| Pima | 97.1 /100 | #108 | Exceptional 98.2% |
| German Russians | 97.1 /100 | #109 | Exceptional 98.2% |
| Immigrants | Singapore | 96.9 /100 | #110 | Exceptional 98.2% |
| Immigrants | Czechoslovakia | 96.8 /100 | #111 | Exceptional 98.2% |
| Immigrants | Norway | 96.6 /100 | #112 | Exceptional 98.2% |
Demographics Similar to Immigrants from Sudan by Nursery School
In terms of nursery school, the demographic groups most similar to Immigrants from Sudan are Immigrants from Syria (97.7%, a difference of 0.0%), Immigrants from Zaire (97.8%, a difference of 0.010%), Tongan (97.8%, a difference of 0.010%), Immigrants from Nepal (97.7%, a difference of 0.010%), and Immigrants from Costa Rica (97.7%, a difference of 0.010%).
| Demographics | Rating | Rank | Nursery School |
| Uruguayans | 7.1 /100 | #216 | Tragic 97.8% |
| Samoans | 6.3 /100 | #217 | Tragic 97.8% |
| Immigrants | Panama | 5.3 /100 | #218 | Tragic 97.8% |
| Immigrants | Morocco | 5.1 /100 | #219 | Tragic 97.8% |
| Immigrants | Zaire | 4.4 /100 | #220 | Tragic 97.8% |
| Tongans | 4.3 /100 | #221 | Tragic 97.8% |
| Immigrants | Syria | 4.0 /100 | #222 | Tragic 97.7% |
| Immigrants | Sudan | 3.9 /100 | #223 | Tragic 97.7% |
| Immigrants | Nepal | 3.6 /100 | #224 | Tragic 97.7% |
| Immigrants | Costa Rica | 3.5 /100 | #225 | Tragic 97.7% |
| Iraqis | 3.5 /100 | #226 | Tragic 97.7% |
| Sub-Saharan Africans | 3.2 /100 | #227 | Tragic 97.7% |
| Sudanese | 3.2 /100 | #228 | Tragic 97.7% |
| Senegalese | 3.2 /100 | #229 | Tragic 97.7% |
| Sierra Leoneans | 2.9 /100 | #230 | Tragic 97.7% |