Turkish vs Burmese Births to Unmarried Women
COMPARE
Turkish
Burmese
Births to Unmarried Women
Births to Unmarried Women Comparison
Turks
Burmese
27.4%
BIRTHS TO UNMARRIED WOMEN
99.6/ 100
METRIC RATING
40th/ 347
METRIC RANK
26.4%
BIRTHS TO UNMARRIED WOMEN
99.9/ 100
METRIC RATING
22nd/ 347
METRIC RANK
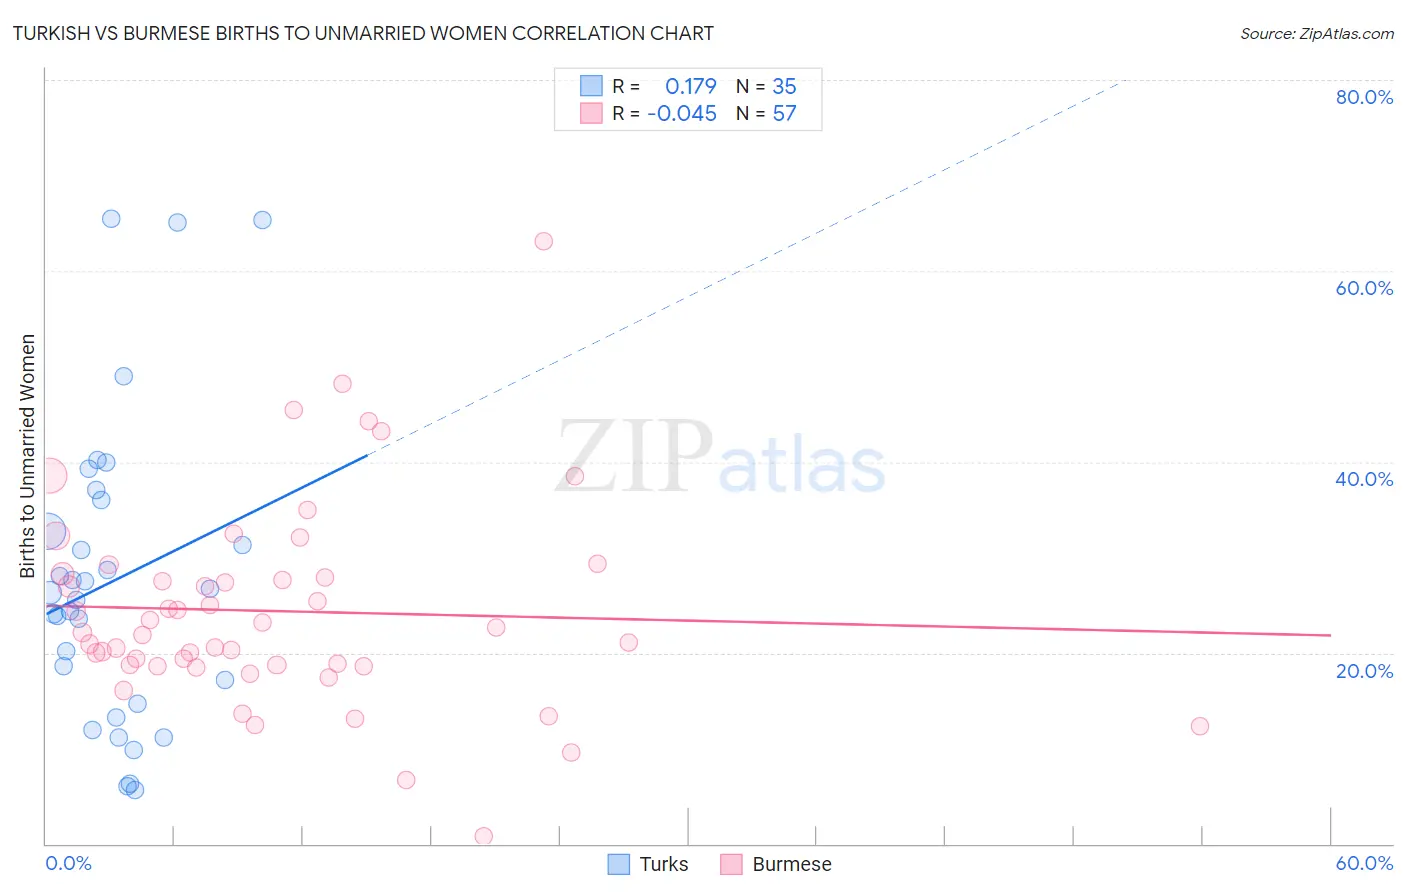
Turkish vs Burmese Births to Unmarried Women Correlation Chart
The statistical analysis conducted on geographies consisting of 255,026,742 people shows a poor positive correlation between the proportion of Turks and percentage of births to unmarried women in the United States with a correlation coefficient (R) of 0.179 and weighted average of 27.4%. Similarly, the statistical analysis conducted on geographies consisting of 428,519,429 people shows no correlation between the proportion of Burmese and percentage of births to unmarried women in the United States with a correlation coefficient (R) of -0.045 and weighted average of 26.4%, a difference of 4.1%.
Births to Unmarried Women Correlation Summary
| Measurement | Turkish | Burmese |
| Minimum | 5.6% | 0.80% |
| Maximum | 65.5% | 63.1% |
| Range | 59.9% | 62.3% |
| Mean | 27.5% | 24.4% |
| Median | 26.3% | 22.1% |
| Interquartile 25% (IQ1) | 14.6% | 18.7% |
| Interquartile 75% (IQ3) | 36.0% | 28.1% |
| Interquartile Range (IQR) | 21.4% | 9.4% |
| Standard Deviation (Sample) | 15.9% | 10.7% |
| Standard Deviation (Population) | 15.7% | 10.6% |
Demographics Similar to Turks and Burmese by Births to Unmarried Women
In terms of births to unmarried women, the demographic groups most similar to Turks are Immigrants from Malaysia (27.4%, a difference of 0.32%), Iraqi (27.6%, a difference of 0.41%), Immigrants from Moldova (27.3%, a difference of 0.61%), Immigrants from Ukraine (27.2%, a difference of 0.75%), and Immigrants from Western Asia (27.2%, a difference of 0.84%). Similarly, the demographic groups most similar to Burmese are Immigrants from Japan (26.4%, a difference of 0.19%), Soviet Union (26.3%, a difference of 0.22%), Immigrants from Australia (26.6%, a difference of 0.98%), Cambodian (26.7%, a difference of 1.2%), and Asian (26.8%, a difference of 1.6%).
| Demographics | Rating | Rank | Births to Unmarried Women |
| Soviet Union | 99.9 /100 | #21 | Exceptional 26.3% |
| Burmese | 99.9 /100 | #22 | Exceptional 26.4% |
| Immigrants | Japan | 99.9 /100 | #23 | Exceptional 26.4% |
| Immigrants | Australia | 99.9 /100 | #24 | Exceptional 26.6% |
| Cambodians | 99.9 /100 | #25 | Exceptional 26.7% |
| Asians | 99.9 /100 | #26 | Exceptional 26.8% |
| Immigrants | Asia | 99.9 /100 | #27 | Exceptional 26.8% |
| Okinawans | 99.8 /100 | #28 | Exceptional 26.9% |
| Cypriots | 99.8 /100 | #29 | Exceptional 27.0% |
| Bulgarians | 99.8 /100 | #30 | Exceptional 27.1% |
| Immigrants | Iraq | 99.8 /100 | #31 | Exceptional 27.1% |
| Immigrants | Russia | 99.8 /100 | #32 | Exceptional 27.1% |
| Immigrants | Sri Lanka | 99.8 /100 | #33 | Exceptional 27.2% |
| Immigrants | Pakistan | 99.8 /100 | #34 | Exceptional 27.2% |
| Immigrants | Ireland | 99.7 /100 | #35 | Exceptional 27.2% |
| Immigrants | Western Asia | 99.7 /100 | #36 | Exceptional 27.2% |
| Immigrants | Ukraine | 99.7 /100 | #37 | Exceptional 27.2% |
| Immigrants | Moldova | 99.7 /100 | #38 | Exceptional 27.3% |
| Immigrants | Malaysia | 99.7 /100 | #39 | Exceptional 27.4% |
| Turks | 99.6 /100 | #40 | Exceptional 27.4% |
| Iraqis | 99.6 /100 | #41 | Exceptional 27.6% |