Turkish vs Immigrants from Canada Births to Unmarried Women
COMPARE
Turkish
Immigrants from Canada
Births to Unmarried Women
Births to Unmarried Women Comparison
Turks
Immigrants from Canada
27.4%
BIRTHS TO UNMARRIED WOMEN
99.6/ 100
METRIC RATING
40th/ 347
METRIC RANK
30.4%
BIRTHS TO UNMARRIED WOMEN
83.7/ 100
METRIC RATING
139th/ 347
METRIC RANK
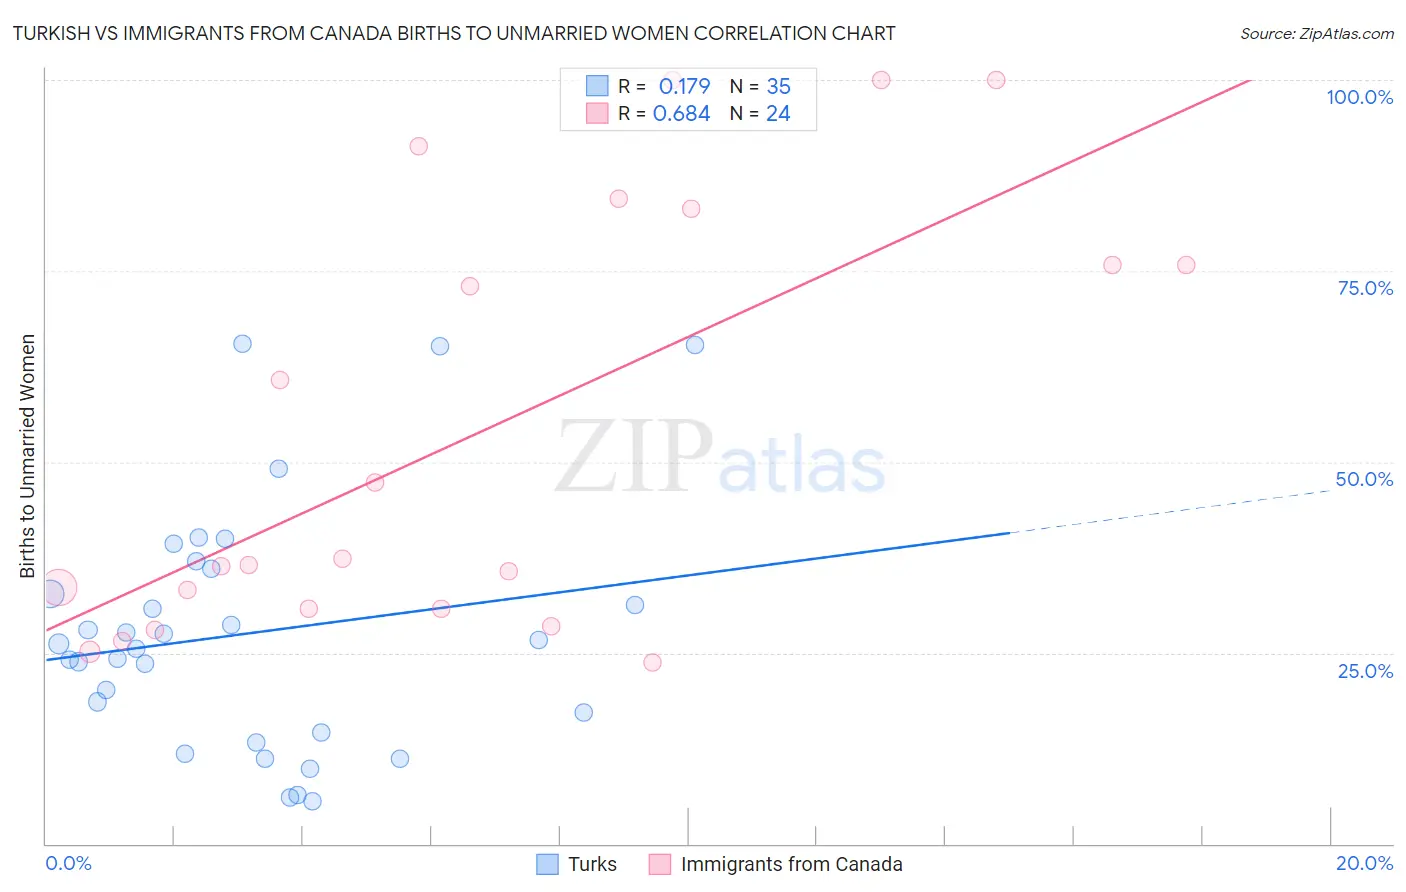
Turkish vs Immigrants from Canada Births to Unmarried Women Correlation Chart
The statistical analysis conducted on geographies consisting of 255,026,742 people shows a poor positive correlation between the proportion of Turks and percentage of births to unmarried women in the United States with a correlation coefficient (R) of 0.179 and weighted average of 27.4%. Similarly, the statistical analysis conducted on geographies consisting of 419,760,568 people shows a significant positive correlation between the proportion of Immigrants from Canada and percentage of births to unmarried women in the United States with a correlation coefficient (R) of 0.684 and weighted average of 30.4%, a difference of 10.9%.
Births to Unmarried Women Correlation Summary
| Measurement | Turkish | Immigrants from Canada |
| Minimum | 5.6% | 23.8% |
| Maximum | 65.5% | 100.0% |
| Range | 59.9% | 76.2% |
| Mean | 27.5% | 54.1% |
| Median | 26.3% | 36.9% |
| Interquartile 25% (IQ1) | 14.6% | 30.8% |
| Interquartile 75% (IQ3) | 36.0% | 79.4% |
| Interquartile Range (IQR) | 21.4% | 48.7% |
| Standard Deviation (Sample) | 15.9% | 27.9% |
| Standard Deviation (Population) | 15.7% | 27.3% |
Similar Demographics by Births to Unmarried Women
Demographics Similar to Turks by Births to Unmarried Women
In terms of births to unmarried women, the demographic groups most similar to Turks are Immigrants from Malaysia (27.4%, a difference of 0.32%), Iraqi (27.6%, a difference of 0.41%), Immigrants from Eastern Europe (27.6%, a difference of 0.43%), Immigrants from Moldova (27.3%, a difference of 0.61%), and Immigrants from Bulgaria (27.6%, a difference of 0.66%).
| Demographics | Rating | Rank | Births to Unmarried Women |
| Immigrants | Sri Lanka | 99.8 /100 | #33 | Exceptional 27.2% |
| Immigrants | Pakistan | 99.8 /100 | #34 | Exceptional 27.2% |
| Immigrants | Ireland | 99.7 /100 | #35 | Exceptional 27.2% |
| Immigrants | Western Asia | 99.7 /100 | #36 | Exceptional 27.2% |
| Immigrants | Ukraine | 99.7 /100 | #37 | Exceptional 27.2% |
| Immigrants | Moldova | 99.7 /100 | #38 | Exceptional 27.3% |
| Immigrants | Malaysia | 99.7 /100 | #39 | Exceptional 27.4% |
| Turks | 99.6 /100 | #40 | Exceptional 27.4% |
| Iraqis | 99.6 /100 | #41 | Exceptional 27.6% |
| Immigrants | Eastern Europe | 99.6 /100 | #42 | Exceptional 27.6% |
| Immigrants | Bulgaria | 99.6 /100 | #43 | Exceptional 27.6% |
| Immigrants | Indonesia | 99.5 /100 | #44 | Exceptional 27.7% |
| Latvians | 99.5 /100 | #45 | Exceptional 27.7% |
| Immigrants | Lithuania | 99.5 /100 | #46 | Exceptional 27.7% |
| Hmong | 99.5 /100 | #47 | Exceptional 27.7% |
Demographics Similar to Immigrants from Canada by Births to Unmarried Women
In terms of births to unmarried women, the demographic groups most similar to Immigrants from Canada are Puget Sound Salish (30.4%, a difference of 0.030%), Immigrants from Philippines (30.4%, a difference of 0.040%), Swiss (30.5%, a difference of 0.11%), Pakistani (30.5%, a difference of 0.13%), and Immigrants from Scotland (30.4%, a difference of 0.16%).
| Demographics | Rating | Rank | Births to Unmarried Women |
| New Zealanders | 85.5 /100 | #132 | Excellent 30.3% |
| Immigrants | Morocco | 85.2 /100 | #133 | Excellent 30.4% |
| Immigrants | South Eastern Asia | 85.2 /100 | #134 | Excellent 30.4% |
| Brazilians | 84.8 /100 | #135 | Excellent 30.4% |
| Immigrants | Scotland | 84.6 /100 | #136 | Excellent 30.4% |
| Immigrants | Philippines | 83.9 /100 | #137 | Excellent 30.4% |
| Puget Sound Salish | 83.9 /100 | #138 | Excellent 30.4% |
| Immigrants | Canada | 83.7 /100 | #139 | Excellent 30.4% |
| Swiss | 83.1 /100 | #140 | Excellent 30.5% |
| Pakistanis | 83.0 /100 | #141 | Excellent 30.5% |
| South Africans | 82.7 /100 | #142 | Excellent 30.5% |
| Immigrants | Uganda | 82.6 /100 | #143 | Excellent 30.5% |
| Czechs | 82.1 /100 | #144 | Excellent 30.5% |
| Immigrants | North America | 81.5 /100 | #145 | Excellent 30.6% |
| Northern Europeans | 81.4 /100 | #146 | Excellent 30.6% |