Cajun vs Immigrants from Uganda Average Family Size
COMPARE
Cajun
Immigrants from Uganda
Average Family Size
Average Family Size Comparison
Cajuns
Immigrants from Uganda
3.17
AVERAGE FAMILY SIZE
2.4/ 100
METRIC RATING
247th/ 347
METRIC RANK
3.23
AVERAGE FAMILY SIZE
60.1/ 100
METRIC RATING
162nd/ 347
METRIC RANK
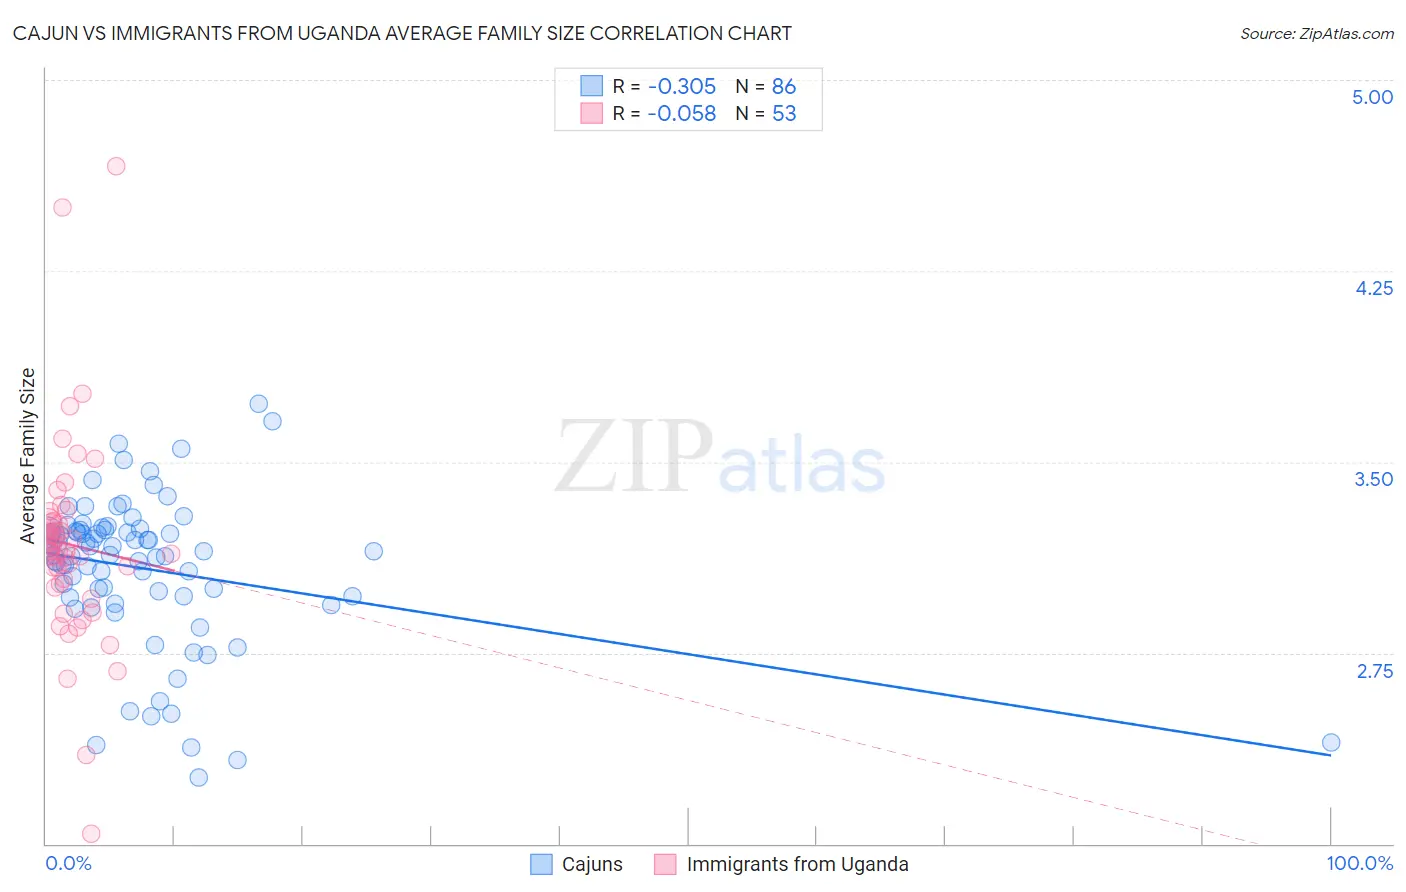
Cajun vs Immigrants from Uganda Average Family Size Correlation Chart
The statistical analysis conducted on geographies consisting of 149,695,466 people shows a mild negative correlation between the proportion of Cajuns and average family size in the United States with a correlation coefficient (R) of -0.305 and weighted average of 3.17. Similarly, the statistical analysis conducted on geographies consisting of 125,974,533 people shows a slight negative correlation between the proportion of Immigrants from Uganda and average family size in the United States with a correlation coefficient (R) of -0.058 and weighted average of 3.23, a difference of 1.9%.
Average Family Size Correlation Summary
| Measurement | Cajun | Immigrants from Uganda |
| Minimum | 2.26 | 2.04 |
| Maximum | 3.73 | 4.66 |
| Range | 1.47 | 2.62 |
| Mean | 3.08 | 3.18 |
| Median | 3.14 | 3.15 |
| Interquartile 25% (IQ1) | 2.97 | 3.01 |
| Interquartile 75% (IQ3) | 3.23 | 3.27 |
| Interquartile Range (IQR) | 0.26 | 0.25 |
| Standard Deviation (Sample) | 0.30 | 0.41 |
| Standard Deviation (Population) | 0.29 | 0.40 |
Similar Demographics by Average Family Size
Demographics Similar to Cajuns by Average Family Size
In terms of average family size, the demographic groups most similar to Cajuns are Danish (3.17, a difference of 0.010%), Immigrants from Belarus (3.17, a difference of 0.030%), Immigrants from Brazil (3.18, a difference of 0.050%), Immigrants from Eastern Europe (3.17, a difference of 0.070%), and Immigrants from Southern Europe (3.18, a difference of 0.080%).
| Demographics | Rating | Rank | Average Family Size |
| Osage | 3.2 /100 | #240 | Tragic 3.18 |
| Immigrants | Japan | 3.0 /100 | #241 | Tragic 3.18 |
| Hungarians | 3.0 /100 | #242 | Tragic 3.18 |
| Immigrants | Moldova | 2.9 /100 | #243 | Tragic 3.18 |
| Immigrants | Southern Europe | 2.9 /100 | #244 | Tragic 3.18 |
| Immigrants | Brazil | 2.7 /100 | #245 | Tragic 3.18 |
| Danes | 2.5 /100 | #246 | Tragic 3.17 |
| Cajuns | 2.4 /100 | #247 | Tragic 3.17 |
| Immigrants | Belarus | 2.3 /100 | #248 | Tragic 3.17 |
| Immigrants | Eastern Europe | 2.1 /100 | #249 | Tragic 3.17 |
| Puget Sound Salish | 1.9 /100 | #250 | Tragic 3.17 |
| Immigrants | Spain | 1.8 /100 | #251 | Tragic 3.17 |
| Immigrants | Saudi Arabia | 1.7 /100 | #252 | Tragic 3.17 |
| South Africans | 1.7 /100 | #253 | Tragic 3.17 |
| Immigrants | Hungary | 1.7 /100 | #254 | Tragic 3.17 |
Demographics Similar to Immigrants from Uganda by Average Family Size
In terms of average family size, the demographic groups most similar to Immigrants from Uganda are Uruguayan (3.23, a difference of 0.020%), Egyptian (3.23, a difference of 0.030%), Ugandan (3.23, a difference of 0.030%), Immigrants from Senegal (3.23, a difference of 0.050%), and Immigrants from Chile (3.24, a difference of 0.060%).
| Demographics | Rating | Rank | Average Family Size |
| Seminole | 68.2 /100 | #155 | Good 3.24 |
| Immigrants | Taiwan | 68.1 /100 | #156 | Good 3.24 |
| Immigrants | Uzbekistan | 67.0 /100 | #157 | Good 3.24 |
| Iraqis | 64.3 /100 | #158 | Good 3.24 |
| Ethiopians | 63.9 /100 | #159 | Good 3.24 |
| Immigrants | Iraq | 63.7 /100 | #160 | Good 3.24 |
| Immigrants | Chile | 63.2 /100 | #161 | Good 3.24 |
| Immigrants | Uganda | 60.1 /100 | #162 | Good 3.23 |
| Uruguayans | 58.8 /100 | #163 | Average 3.23 |
| Egyptians | 58.6 /100 | #164 | Average 3.23 |
| Ugandans | 58.4 /100 | #165 | Average 3.23 |
| Immigrants | Senegal | 57.5 /100 | #166 | Average 3.23 |
| Dutch West Indians | 56.9 /100 | #167 | Average 3.23 |
| Taiwanese | 54.2 /100 | #168 | Average 3.23 |
| Aleuts | 54.1 /100 | #169 | Average 3.23 |