Nepalese vs Immigrants from Uganda Average Family Size
COMPARE
Nepalese
Immigrants from Uganda
Average Family Size
Average Family Size Comparison
Nepalese
Immigrants from Uganda
3.42
AVERAGE FAMILY SIZE
100.0/ 100
METRIC RATING
29th/ 347
METRIC RANK
3.23
AVERAGE FAMILY SIZE
60.1/ 100
METRIC RATING
162nd/ 347
METRIC RANK
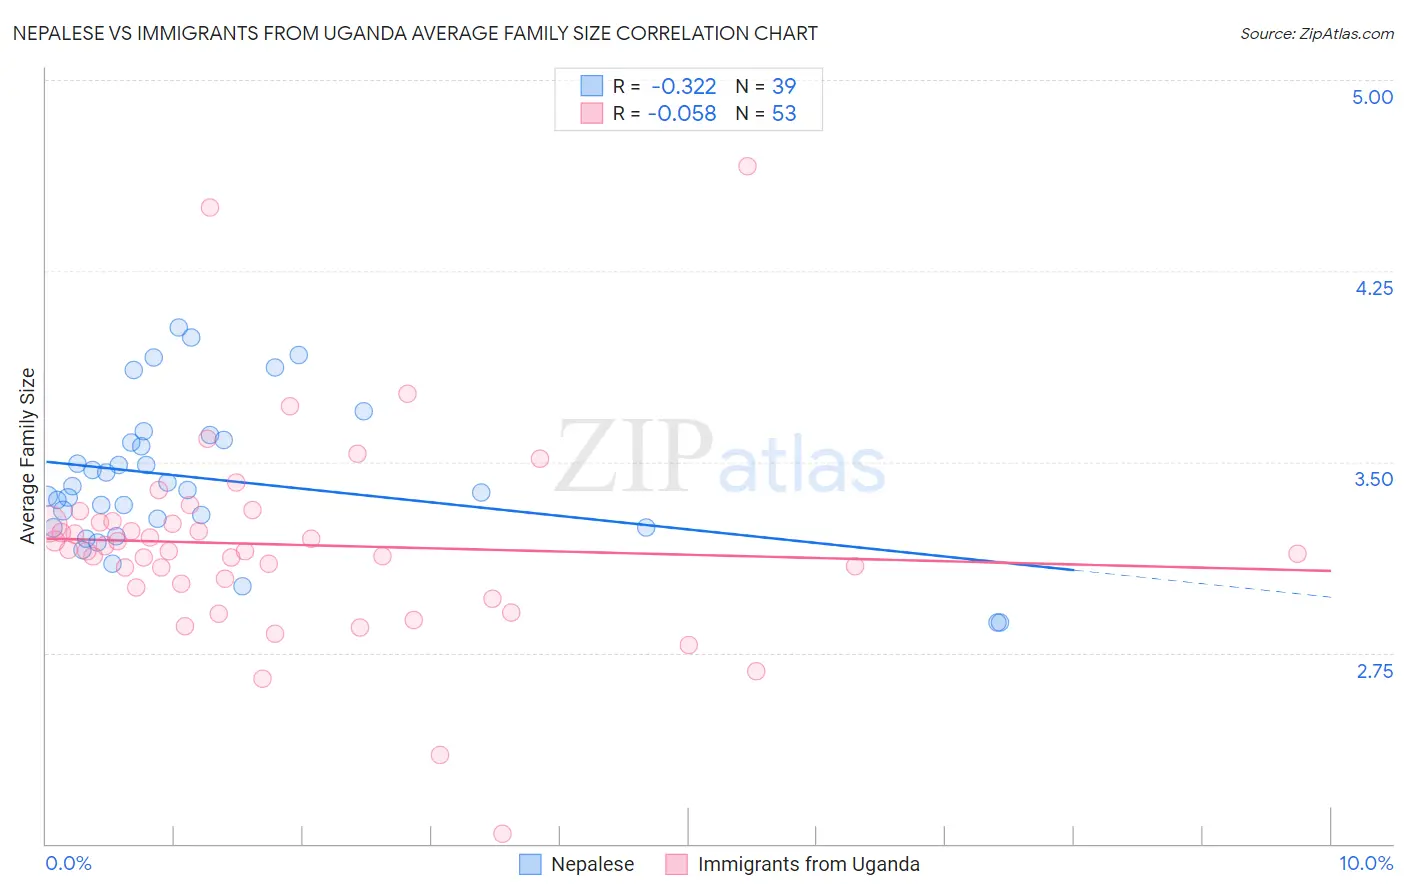
Nepalese vs Immigrants from Uganda Average Family Size Correlation Chart
The statistical analysis conducted on geographies consisting of 24,519,269 people shows a mild negative correlation between the proportion of Nepalese and average family size in the United States with a correlation coefficient (R) of -0.322 and weighted average of 3.42. Similarly, the statistical analysis conducted on geographies consisting of 125,974,533 people shows a slight negative correlation between the proportion of Immigrants from Uganda and average family size in the United States with a correlation coefficient (R) of -0.058 and weighted average of 3.23, a difference of 5.8%.
Average Family Size Correlation Summary
| Measurement | Nepalese | Immigrants from Uganda |
| Minimum | 2.87 | 2.04 |
| Maximum | 4.03 | 4.66 |
| Range | 1.16 | 2.62 |
| Mean | 3.43 | 3.18 |
| Median | 3.39 | 3.15 |
| Interquartile 25% (IQ1) | 3.24 | 3.01 |
| Interquartile 75% (IQ3) | 3.59 | 3.27 |
| Interquartile Range (IQR) | 0.34 | 0.25 |
| Standard Deviation (Sample) | 0.28 | 0.41 |
| Standard Deviation (Population) | 0.28 | 0.40 |
Similar Demographics by Average Family Size
Demographics Similar to Nepalese by Average Family Size
In terms of average family size, the demographic groups most similar to Nepalese are Samoan (3.42, a difference of 0.030%), Immigrants from Latin America (3.42, a difference of 0.090%), Mexican American Indian (3.43, a difference of 0.21%), Native Hawaiian (3.43, a difference of 0.22%), and Central American (3.41, a difference of 0.23%).
| Demographics | Rating | Rank | Average Family Size |
| Apache | 100.0 /100 | #22 | Exceptional 3.46 |
| Immigrants | Fiji | 100.0 /100 | #23 | Exceptional 3.45 |
| Natives/Alaskans | 100.0 /100 | #24 | Exceptional 3.45 |
| Yakama | 100.0 /100 | #25 | Exceptional 3.45 |
| Native Hawaiians | 100.0 /100 | #26 | Exceptional 3.43 |
| Mexican American Indians | 100.0 /100 | #27 | Exceptional 3.43 |
| Immigrants | Latin America | 100.0 /100 | #28 | Exceptional 3.42 |
| Nepalese | 100.0 /100 | #29 | Exceptional 3.42 |
| Samoans | 100.0 /100 | #30 | Exceptional 3.42 |
| Central Americans | 100.0 /100 | #31 | Exceptional 3.41 |
| Immigrants | Guatemala | 100.0 /100 | #32 | Exceptional 3.41 |
| Hawaiians | 100.0 /100 | #33 | Exceptional 3.41 |
| Hispanics or Latinos | 100.0 /100 | #34 | Exceptional 3.41 |
| Guatemalans | 100.0 /100 | #35 | Exceptional 3.40 |
| Immigrants | Guyana | 100.0 /100 | #36 | Exceptional 3.40 |
Demographics Similar to Immigrants from Uganda by Average Family Size
In terms of average family size, the demographic groups most similar to Immigrants from Uganda are Uruguayan (3.23, a difference of 0.020%), Egyptian (3.23, a difference of 0.030%), Ugandan (3.23, a difference of 0.030%), Immigrants from Senegal (3.23, a difference of 0.050%), and Immigrants from Chile (3.24, a difference of 0.060%).
| Demographics | Rating | Rank | Average Family Size |
| Seminole | 68.2 /100 | #155 | Good 3.24 |
| Immigrants | Taiwan | 68.1 /100 | #156 | Good 3.24 |
| Immigrants | Uzbekistan | 67.0 /100 | #157 | Good 3.24 |
| Iraqis | 64.3 /100 | #158 | Good 3.24 |
| Ethiopians | 63.9 /100 | #159 | Good 3.24 |
| Immigrants | Iraq | 63.7 /100 | #160 | Good 3.24 |
| Immigrants | Chile | 63.2 /100 | #161 | Good 3.24 |
| Immigrants | Uganda | 60.1 /100 | #162 | Good 3.23 |
| Uruguayans | 58.8 /100 | #163 | Average 3.23 |
| Egyptians | 58.6 /100 | #164 | Average 3.23 |
| Ugandans | 58.4 /100 | #165 | Average 3.23 |
| Immigrants | Senegal | 57.5 /100 | #166 | Average 3.23 |
| Dutch West Indians | 56.9 /100 | #167 | Average 3.23 |
| Taiwanese | 54.2 /100 | #168 | Average 3.23 |
| Aleuts | 54.1 /100 | #169 | Average 3.23 |