Chippewa vs Immigrants from Uganda Average Family Size
COMPARE
Chippewa
Immigrants from Uganda
Average Family Size
Average Family Size Comparison
Chippewa
Immigrants from Uganda
3.20
AVERAGE FAMILY SIZE
13.3/ 100
METRIC RATING
208th/ 347
METRIC RANK
3.23
AVERAGE FAMILY SIZE
60.1/ 100
METRIC RATING
162nd/ 347
METRIC RANK
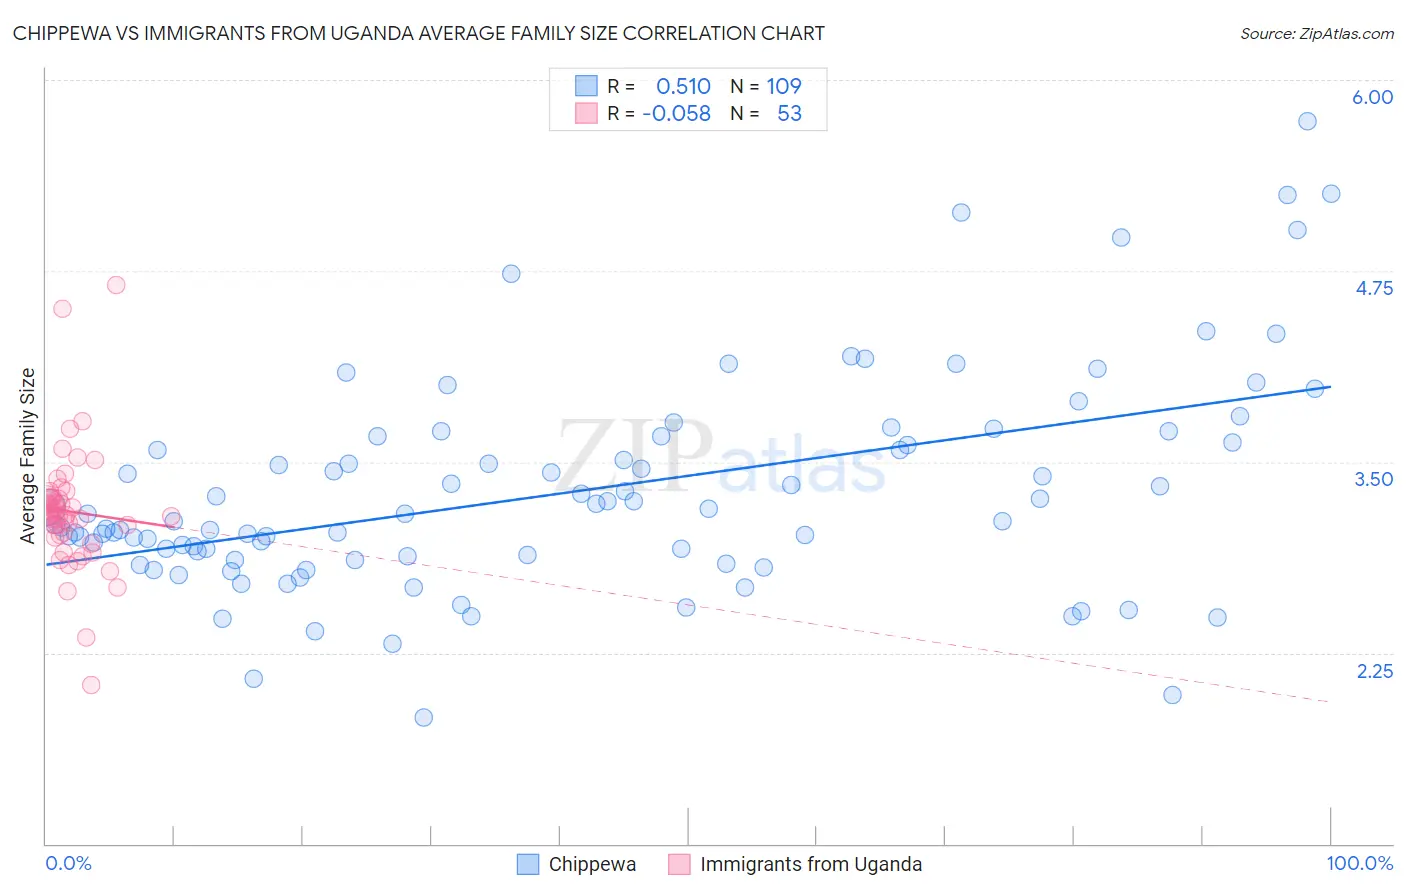
Chippewa vs Immigrants from Uganda Average Family Size Correlation Chart
The statistical analysis conducted on geographies consisting of 215,001,181 people shows a substantial positive correlation between the proportion of Chippewa and average family size in the United States with a correlation coefficient (R) of 0.510 and weighted average of 3.20. Similarly, the statistical analysis conducted on geographies consisting of 125,974,533 people shows a slight negative correlation between the proportion of Immigrants from Uganda and average family size in the United States with a correlation coefficient (R) of -0.058 and weighted average of 3.23, a difference of 1.1%.
Average Family Size Correlation Summary
| Measurement | Chippewa | Immigrants from Uganda |
| Minimum | 1.83 | 2.04 |
| Maximum | 5.73 | 4.66 |
| Range | 3.90 | 2.62 |
| Mean | 3.30 | 3.18 |
| Median | 3.12 | 3.15 |
| Interquartile 25% (IQ1) | 2.87 | 3.01 |
| Interquartile 75% (IQ3) | 3.65 | 3.27 |
| Interquartile Range (IQR) | 0.78 | 0.25 |
| Standard Deviation (Sample) | 0.71 | 0.41 |
| Standard Deviation (Population) | 0.70 | 0.40 |
Similar Demographics by Average Family Size
Demographics Similar to Chippewa by Average Family Size
In terms of average family size, the demographic groups most similar to Chippewa are Sudanese (3.20, a difference of 0.0%), Filipino (3.20, a difference of 0.010%), Zimbabwean (3.20, a difference of 0.030%), Immigrants from Iran (3.20, a difference of 0.050%), and Creek (3.20, a difference of 0.050%).
| Demographics | Rating | Rank | Average Family Size |
| Immigrants | Morocco | 18.5 /100 | #201 | Poor 3.21 |
| Immigrants | India | 18.5 /100 | #202 | Poor 3.21 |
| Immigrants | Nepal | 18.1 /100 | #203 | Poor 3.21 |
| Immigrants | Poland | 16.6 /100 | #204 | Poor 3.20 |
| Paraguayans | 16.3 /100 | #205 | Poor 3.20 |
| Immigrants | Cabo Verde | 16.0 /100 | #206 | Poor 3.20 |
| Filipinos | 13.6 /100 | #207 | Poor 3.20 |
| Chippewa | 13.3 /100 | #208 | Poor 3.20 |
| Sudanese | 13.3 /100 | #209 | Poor 3.20 |
| Zimbabweans | 12.6 /100 | #210 | Poor 3.20 |
| Immigrants | Iran | 12.1 /100 | #211 | Poor 3.20 |
| Creek | 12.1 /100 | #212 | Poor 3.20 |
| Mongolians | 11.5 /100 | #213 | Poor 3.20 |
| Somalis | 11.2 /100 | #214 | Poor 3.20 |
| Delaware | 11.1 /100 | #215 | Poor 3.20 |
Demographics Similar to Immigrants from Uganda by Average Family Size
In terms of average family size, the demographic groups most similar to Immigrants from Uganda are Uruguayan (3.23, a difference of 0.020%), Egyptian (3.23, a difference of 0.030%), Ugandan (3.23, a difference of 0.030%), Immigrants from Senegal (3.23, a difference of 0.050%), and Immigrants from Chile (3.24, a difference of 0.060%).
| Demographics | Rating | Rank | Average Family Size |
| Seminole | 68.2 /100 | #155 | Good 3.24 |
| Immigrants | Taiwan | 68.1 /100 | #156 | Good 3.24 |
| Immigrants | Uzbekistan | 67.0 /100 | #157 | Good 3.24 |
| Iraqis | 64.3 /100 | #158 | Good 3.24 |
| Ethiopians | 63.9 /100 | #159 | Good 3.24 |
| Immigrants | Iraq | 63.7 /100 | #160 | Good 3.24 |
| Immigrants | Chile | 63.2 /100 | #161 | Good 3.24 |
| Immigrants | Uganda | 60.1 /100 | #162 | Good 3.23 |
| Uruguayans | 58.8 /100 | #163 | Average 3.23 |
| Egyptians | 58.6 /100 | #164 | Average 3.23 |
| Ugandans | 58.4 /100 | #165 | Average 3.23 |
| Immigrants | Senegal | 57.5 /100 | #166 | Average 3.23 |
| Dutch West Indians | 56.9 /100 | #167 | Average 3.23 |
| Taiwanese | 54.2 /100 | #168 | Average 3.23 |
| Aleuts | 54.1 /100 | #169 | Average 3.23 |