Tlingit-Haida vs Immigrants from Uganda Unemployment Among Women with Children Ages 6 to 17 years
COMPARE
Tlingit-Haida
Immigrants from Uganda
Unemployment Among Women with Children Ages 6 to 17 years
Unemployment Among Women with Children Ages 6 to 17 years Comparison
Tlingit-Haida
Immigrants from Uganda
7.1%
UNEMPLOYMENT AMONG WOMEN WITH CHILDREN AGES 6 TO 17 YEARS
100.0/ 100
METRIC RATING
6th/ 347
METRIC RANK
10.7%
UNEMPLOYMENT AMONG WOMEN WITH CHILDREN AGES 6 TO 17 YEARS
0.0/ 100
METRIC RATING
319th/ 347
METRIC RANK
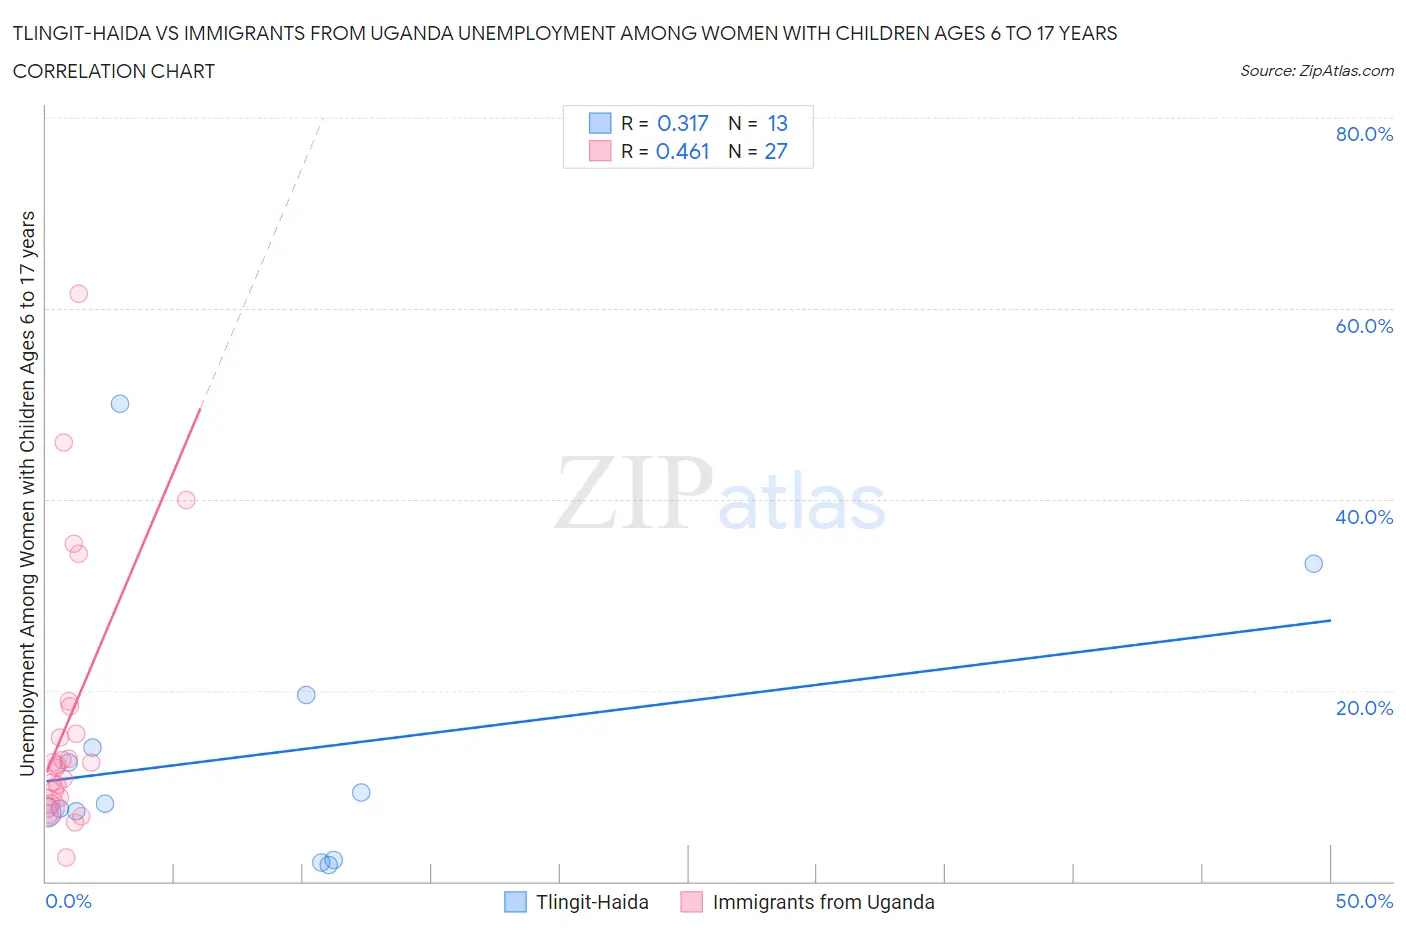
Tlingit-Haida vs Immigrants from Uganda Unemployment Among Women with Children Ages 6 to 17 years Correlation Chart
The statistical analysis conducted on geographies consisting of 52,453,668 people shows a mild positive correlation between the proportion of Tlingit-Haida and unemployment rate among women with children between the ages 6 and 17 in the United States with a correlation coefficient (R) of 0.317 and weighted average of 7.1%. Similarly, the statistical analysis conducted on geographies consisting of 110,485,148 people shows a moderate positive correlation between the proportion of Immigrants from Uganda and unemployment rate among women with children between the ages 6 and 17 in the United States with a correlation coefficient (R) of 0.461 and weighted average of 10.7%, a difference of 50.4%.
Unemployment Among Women with Children Ages 6 to 17 years Correlation Summary
| Measurement | Tlingit-Haida | Immigrants from Uganda |
| Minimum | 1.7% | 2.5% |
| Maximum | 50.0% | 61.5% |
| Range | 48.3% | 59.0% |
| Mean | 13.4% | 16.9% |
| Median | 8.1% | 12.1% |
| Interquartile 25% (IQ1) | 4.7% | 8.1% |
| Interquartile 75% (IQ3) | 16.8% | 18.3% |
| Interquartile Range (IQR) | 12.0% | 10.2% |
| Standard Deviation (Sample) | 13.9% | 14.1% |
| Standard Deviation (Population) | 13.4% | 13.8% |
Similar Demographics by Unemployment Among Women with Children Ages 6 to 17 years
Demographics Similar to Tlingit-Haida by Unemployment Among Women with Children Ages 6 to 17 years
In terms of unemployment among women with children ages 6 to 17 years, the demographic groups most similar to Tlingit-Haida are Soviet Union (7.1%, a difference of 0.060%), Okinawan (7.0%, a difference of 0.47%), Ute (7.0%, a difference of 1.1%), Immigrants from Hong Kong (7.2%, a difference of 1.5%), and Assyrian/Chaldean/Syriac (7.2%, a difference of 1.8%).
| Demographics | Rating | Rank | Unemployment Among Women with Children Ages 6 to 17 years |
| Taiwanese | 100.0 /100 | #1 | Exceptional 6.5% |
| Fijians | 100.0 /100 | #2 | Exceptional 6.6% |
| Tongans | 100.0 /100 | #3 | Exceptional 6.7% |
| Ute | 100.0 /100 | #4 | Exceptional 7.0% |
| Okinawans | 100.0 /100 | #5 | Exceptional 7.0% |
| Tlingit-Haida | 100.0 /100 | #6 | Exceptional 7.1% |
| Soviet Union | 100.0 /100 | #7 | Exceptional 7.1% |
| Immigrants | Hong Kong | 100.0 /100 | #8 | Exceptional 7.2% |
| Assyrians/Chaldeans/Syriacs | 100.0 /100 | #9 | Exceptional 7.2% |
| Immigrants | Fiji | 100.0 /100 | #10 | Exceptional 7.3% |
| Immigrants | Taiwan | 100.0 /100 | #11 | Exceptional 7.3% |
| Bangladeshis | 100.0 /100 | #12 | Exceptional 7.4% |
| Indonesians | 100.0 /100 | #13 | Exceptional 7.4% |
| Sudanese | 100.0 /100 | #14 | Exceptional 7.4% |
| Puget Sound Salish | 100.0 /100 | #15 | Exceptional 7.5% |
Demographics Similar to Immigrants from Uganda by Unemployment Among Women with Children Ages 6 to 17 years
In terms of unemployment among women with children ages 6 to 17 years, the demographic groups most similar to Immigrants from Uganda are Apache (10.7%, a difference of 0.020%), Tohono O'odham (10.7%, a difference of 0.19%), Delaware (10.5%, a difference of 1.3%), Bermudan (10.5%, a difference of 1.3%), and Immigrants from Dominica (10.5%, a difference of 1.4%).
| Demographics | Rating | Rank | Unemployment Among Women with Children Ages 6 to 17 years |
| Africans | 0.0 /100 | #312 | Tragic 10.4% |
| Americans | 0.0 /100 | #313 | Tragic 10.4% |
| Immigrants | Cabo Verde | 0.0 /100 | #314 | Tragic 10.4% |
| Bahamians | 0.0 /100 | #315 | Tragic 10.4% |
| Immigrants | Dominica | 0.0 /100 | #316 | Tragic 10.5% |
| Bermudans | 0.0 /100 | #317 | Tragic 10.5% |
| Delaware | 0.0 /100 | #318 | Tragic 10.5% |
| Immigrants | Uganda | 0.0 /100 | #319 | Tragic 10.7% |
| Apache | 0.0 /100 | #320 | Tragic 10.7% |
| Tohono O'odham | 0.0 /100 | #321 | Tragic 10.7% |
| Cree | 0.0 /100 | #322 | Tragic 10.8% |
| Dominicans | 0.0 /100 | #323 | Tragic 10.8% |
| Immigrants | Dominican Republic | 0.0 /100 | #324 | Tragic 10.8% |
| Cajuns | 0.0 /100 | #325 | Tragic 10.8% |
| Liberians | 0.0 /100 | #326 | Tragic 10.8% |