Ghanaian vs Immigrants from Uganda Average Family Size
COMPARE
Ghanaian
Immigrants from Uganda
Average Family Size
Average Family Size Comparison
Ghanaians
Immigrants from Uganda
3.29
AVERAGE FAMILY SIZE
98.0/ 100
METRIC RATING
107th/ 347
METRIC RANK
3.23
AVERAGE FAMILY SIZE
60.1/ 100
METRIC RATING
162nd/ 347
METRIC RANK
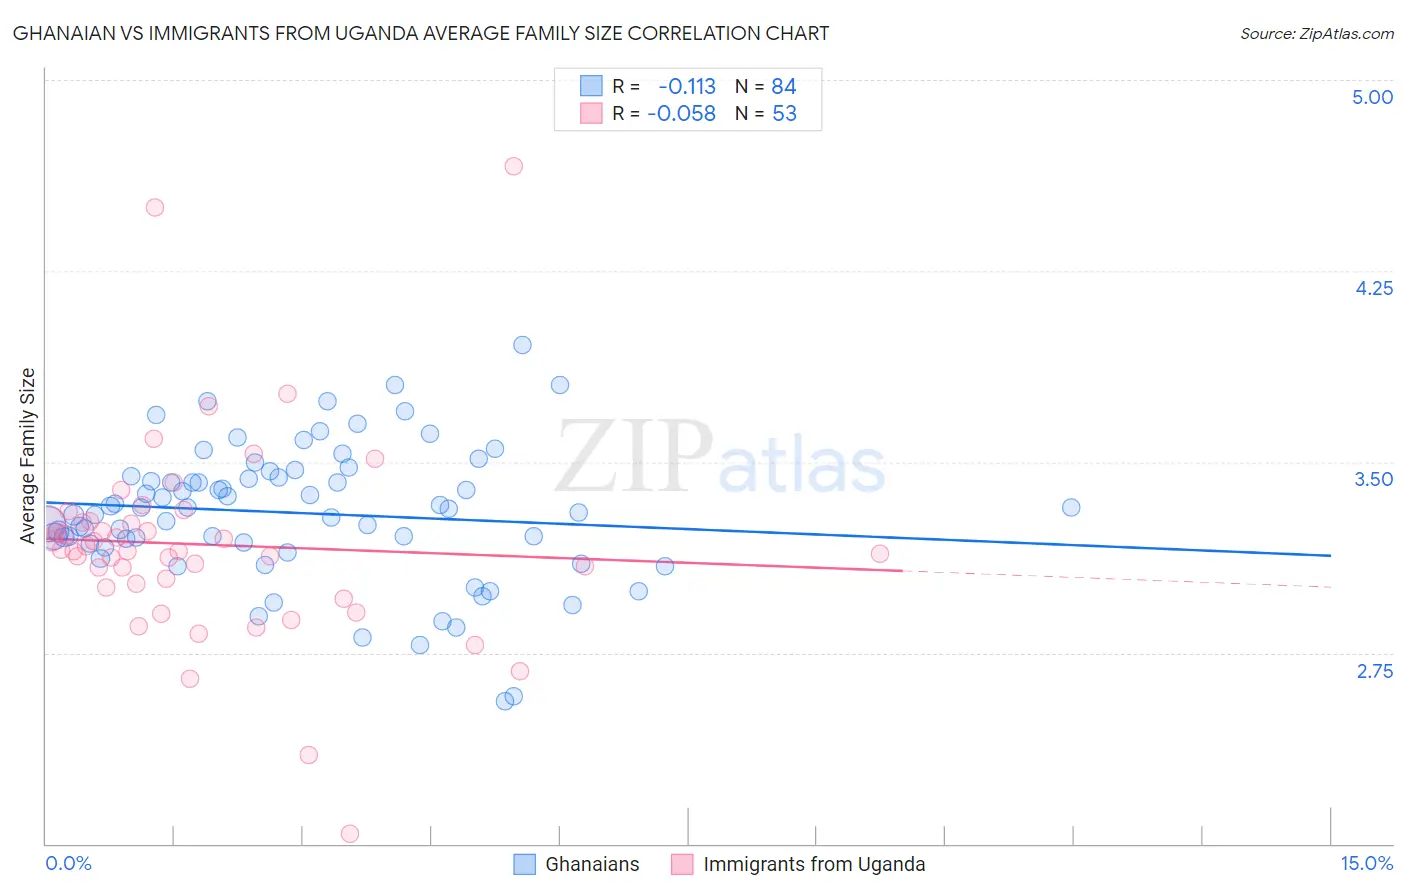
Ghanaian vs Immigrants from Uganda Average Family Size Correlation Chart
The statistical analysis conducted on geographies consisting of 190,523,422 people shows a poor negative correlation between the proportion of Ghanaians and average family size in the United States with a correlation coefficient (R) of -0.113 and weighted average of 3.29. Similarly, the statistical analysis conducted on geographies consisting of 125,974,533 people shows a slight negative correlation between the proportion of Immigrants from Uganda and average family size in the United States with a correlation coefficient (R) of -0.058 and weighted average of 3.23, a difference of 1.6%.
Average Family Size Correlation Summary
| Measurement | Ghanaian | Immigrants from Uganda |
| Minimum | 2.56 | 2.04 |
| Maximum | 3.96 | 4.66 |
| Range | 1.40 | 2.62 |
| Mean | 3.30 | 3.18 |
| Median | 3.32 | 3.15 |
| Interquartile 25% (IQ1) | 3.18 | 3.01 |
| Interquartile 75% (IQ3) | 3.44 | 3.27 |
| Interquartile Range (IQR) | 0.26 | 0.25 |
| Standard Deviation (Sample) | 0.26 | 0.41 |
| Standard Deviation (Population) | 0.26 | 0.40 |
Similar Demographics by Average Family Size
Demographics Similar to Ghanaians by Average Family Size
In terms of average family size, the demographic groups most similar to Ghanaians are Paiute (3.29, a difference of 0.020%), Immigrants from Ghana (3.29, a difference of 0.030%), Bolivian (3.29, a difference of 0.090%), Immigrants from Western Africa (3.29, a difference of 0.12%), and West Indian (3.29, a difference of 0.15%).
| Demographics | Rating | Rank | Average Family Size |
| Guamanians/Chamorros | 98.6 /100 | #100 | Exceptional 3.29 |
| Immigrants | Burma/Myanmar | 98.6 /100 | #101 | Exceptional 3.29 |
| West Indians | 98.5 /100 | #102 | Exceptional 3.29 |
| Immigrants | Western Africa | 98.4 /100 | #103 | Exceptional 3.29 |
| Bolivians | 98.3 /100 | #104 | Exceptional 3.29 |
| Immigrants | Ghana | 98.1 /100 | #105 | Exceptional 3.29 |
| Paiute | 98.0 /100 | #106 | Exceptional 3.29 |
| Ghanaians | 98.0 /100 | #107 | Exceptional 3.29 |
| Asians | 97.0 /100 | #108 | Exceptional 3.28 |
| Puerto Ricans | 96.7 /100 | #109 | Exceptional 3.28 |
| Bahamians | 96.6 /100 | #110 | Exceptional 3.28 |
| Indonesians | 96.2 /100 | #111 | Exceptional 3.28 |
| Blacks/African Americans | 95.7 /100 | #112 | Exceptional 3.27 |
| Immigrants | Panama | 95.6 /100 | #113 | Exceptional 3.27 |
| South Americans | 95.1 /100 | #114 | Exceptional 3.27 |
Demographics Similar to Immigrants from Uganda by Average Family Size
In terms of average family size, the demographic groups most similar to Immigrants from Uganda are Uruguayan (3.23, a difference of 0.020%), Egyptian (3.23, a difference of 0.030%), Ugandan (3.23, a difference of 0.030%), Immigrants from Senegal (3.23, a difference of 0.050%), and Immigrants from Chile (3.24, a difference of 0.060%).
| Demographics | Rating | Rank | Average Family Size |
| Seminole | 68.2 /100 | #155 | Good 3.24 |
| Immigrants | Taiwan | 68.1 /100 | #156 | Good 3.24 |
| Immigrants | Uzbekistan | 67.0 /100 | #157 | Good 3.24 |
| Iraqis | 64.3 /100 | #158 | Good 3.24 |
| Ethiopians | 63.9 /100 | #159 | Good 3.24 |
| Immigrants | Iraq | 63.7 /100 | #160 | Good 3.24 |
| Immigrants | Chile | 63.2 /100 | #161 | Good 3.24 |
| Immigrants | Uganda | 60.1 /100 | #162 | Good 3.23 |
| Uruguayans | 58.8 /100 | #163 | Average 3.23 |
| Egyptians | 58.6 /100 | #164 | Average 3.23 |
| Ugandans | 58.4 /100 | #165 | Average 3.23 |
| Immigrants | Senegal | 57.5 /100 | #166 | Average 3.23 |
| Dutch West Indians | 56.9 /100 | #167 | Average 3.23 |
| Taiwanese | 54.2 /100 | #168 | Average 3.23 |
| Aleuts | 54.1 /100 | #169 | Average 3.23 |