Tlingit-Haida vs Immigrants from Uganda In Labor Force | Age 16-19
COMPARE
Tlingit-Haida
Immigrants from Uganda
In Labor Force | Age 16-19
In Labor Force | Age 16-19 Comparison
Tlingit-Haida
Immigrants from Uganda
40.5%
IN LABOR FORCE | AGE 16-19
100.0/ 100
METRIC RATING
54th/ 347
METRIC RANK
39.2%
IN LABOR FORCE | AGE 16-19
99.7/ 100
METRIC RATING
84th/ 347
METRIC RANK
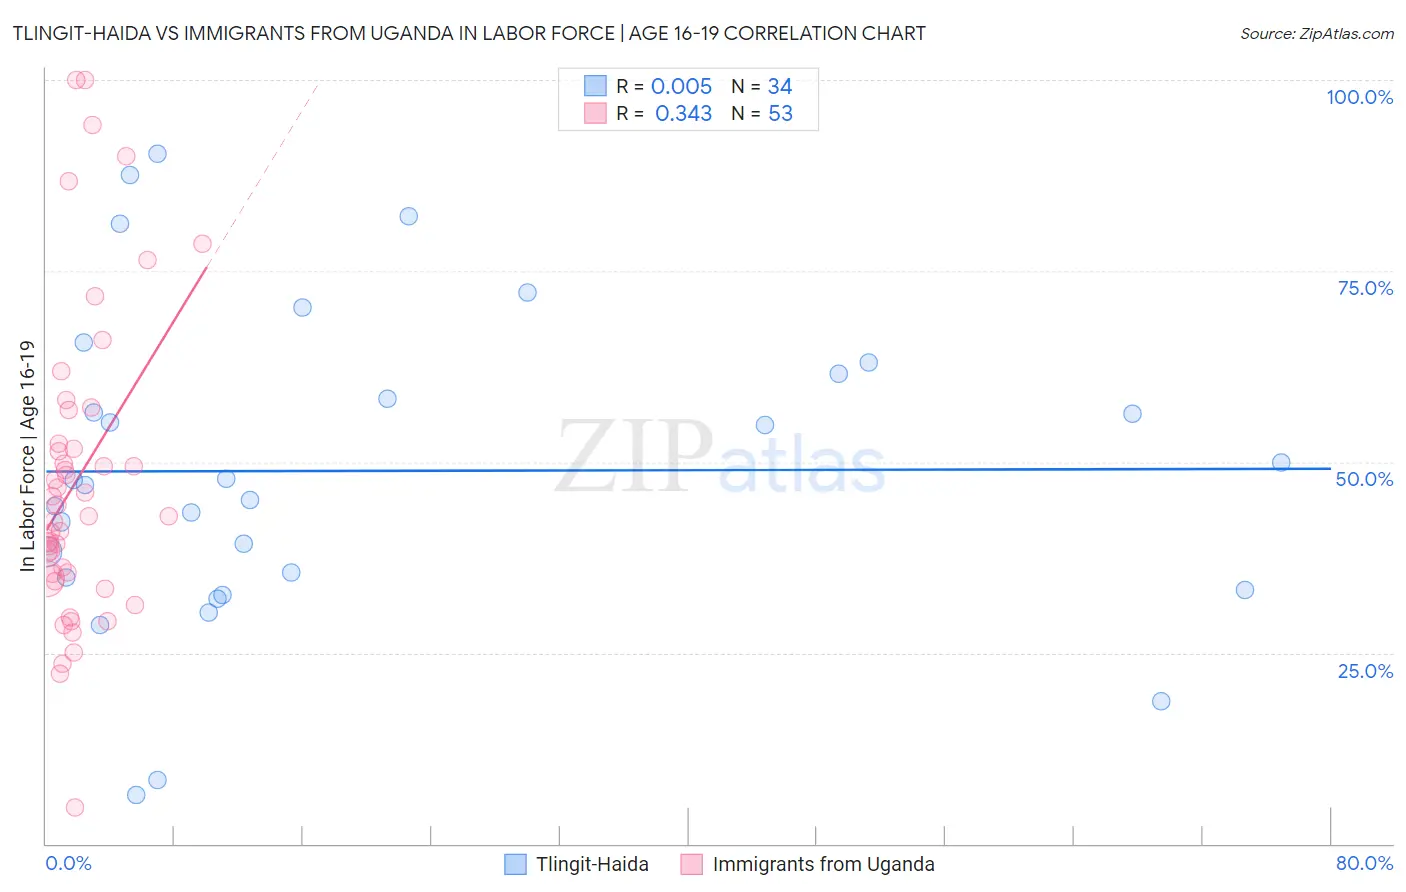
Tlingit-Haida vs Immigrants from Uganda In Labor Force | Age 16-19 Correlation Chart
The statistical analysis conducted on geographies consisting of 60,837,645 people shows no correlation between the proportion of Tlingit-Haida and labor force participation rate among population between the ages 16 and 19 in the United States with a correlation coefficient (R) of 0.005 and weighted average of 40.5%. Similarly, the statistical analysis conducted on geographies consisting of 125,968,157 people shows a mild positive correlation between the proportion of Immigrants from Uganda and labor force participation rate among population between the ages 16 and 19 in the United States with a correlation coefficient (R) of 0.343 and weighted average of 39.2%, a difference of 3.3%.
In Labor Force | Age 16-19 Correlation Summary
| Measurement | Tlingit-Haida | Immigrants from Uganda |
| Minimum | 6.4% | 4.7% |
| Maximum | 90.3% | 100.0% |
| Range | 83.9% | 95.3% |
| Mean | 48.8% | 47.8% |
| Median | 47.3% | 42.9% |
| Interquartile 25% (IQ1) | 34.8% | 35.0% |
| Interquartile 75% (IQ3) | 61.5% | 54.6% |
| Interquartile Range (IQR) | 26.7% | 19.6% |
| Standard Deviation (Sample) | 20.5% | 20.3% |
| Standard Deviation (Population) | 20.2% | 20.1% |
Similar Demographics by In Labor Force | Age 16-19
Demographics Similar to Tlingit-Haida by In Labor Force | Age 16-19
In terms of in labor force | age 16-19, the demographic groups most similar to Tlingit-Haida are Immigrants from Kenya (40.5%, a difference of 0.030%), British (40.5%, a difference of 0.030%), Fijian (40.4%, a difference of 0.12%), Lithuanian (40.4%, a difference of 0.14%), and Aleut (40.4%, a difference of 0.16%).
| Demographics | Rating | Rank | In Labor Force | Age 16-19 |
| Carpatho Rusyns | 100.0 /100 | #47 | Exceptional 40.8% |
| Icelanders | 100.0 /100 | #48 | Exceptional 40.8% |
| Cree | 100.0 /100 | #49 | Exceptional 40.8% |
| Indonesians | 100.0 /100 | #50 | Exceptional 40.7% |
| Immigrants | Zaire | 100.0 /100 | #51 | Exceptional 40.7% |
| Immigrants | Laos | 100.0 /100 | #52 | Exceptional 40.6% |
| Immigrants | Kenya | 100.0 /100 | #53 | Exceptional 40.5% |
| Tlingit-Haida | 100.0 /100 | #54 | Exceptional 40.5% |
| British | 100.0 /100 | #55 | Exceptional 40.5% |
| Fijians | 100.0 /100 | #56 | Exceptional 40.4% |
| Lithuanians | 100.0 /100 | #57 | Exceptional 40.4% |
| Aleuts | 100.0 /100 | #58 | Exceptional 40.4% |
| Slavs | 100.0 /100 | #59 | Exceptional 40.4% |
| Immigrants | Eastern Africa | 100.0 /100 | #60 | Exceptional 40.4% |
| Americans | 100.0 /100 | #61 | Exceptional 40.3% |
Demographics Similar to Immigrants from Uganda by In Labor Force | Age 16-19
In terms of in labor force | age 16-19, the demographic groups most similar to Immigrants from Uganda are Spanish (39.3%, a difference of 0.13%), Basque (39.3%, a difference of 0.15%), Creek (39.1%, a difference of 0.15%), Samoan (39.1%, a difference of 0.17%), and Shoshone (39.3%, a difference of 0.21%).
| Demographics | Rating | Rank | In Labor Force | Age 16-19 |
| Immigrants | Portugal | 99.9 /100 | #77 | Exceptional 39.7% |
| Austrians | 99.8 /100 | #78 | Exceptional 39.5% |
| Marshallese | 99.8 /100 | #79 | Exceptional 39.5% |
| Immigrants | Iraq | 99.8 /100 | #80 | Exceptional 39.4% |
| Shoshone | 99.7 /100 | #81 | Exceptional 39.3% |
| Basques | 99.7 /100 | #82 | Exceptional 39.3% |
| Spanish | 99.7 /100 | #83 | Exceptional 39.3% |
| Immigrants | Uganda | 99.7 /100 | #84 | Exceptional 39.2% |
| Creek | 99.6 /100 | #85 | Exceptional 39.1% |
| Samoans | 99.6 /100 | #86 | Exceptional 39.1% |
| Immigrants | Germany | 99.6 /100 | #87 | Exceptional 39.1% |
| Puget Sound Salish | 99.6 /100 | #88 | Exceptional 39.1% |
| Alaska Natives | 99.6 /100 | #89 | Exceptional 39.1% |
| Immigrants | Burma/Myanmar | 99.5 /100 | #90 | Exceptional 39.0% |
| Spanish Americans | 99.5 /100 | #91 | Exceptional 39.0% |