Scotch-Irish vs Swiss Average Family Size
COMPARE
Scotch-Irish
Swiss
Average Family Size
Average Family Size Comparison
Scotch-Irish
Swiss
3.11
AVERAGE FAMILY SIZE
0.0/ 100
METRIC RATING
331st/ 347
METRIC RANK
3.15
AVERAGE FAMILY SIZE
0.5/ 100
METRIC RATING
277th/ 347
METRIC RANK
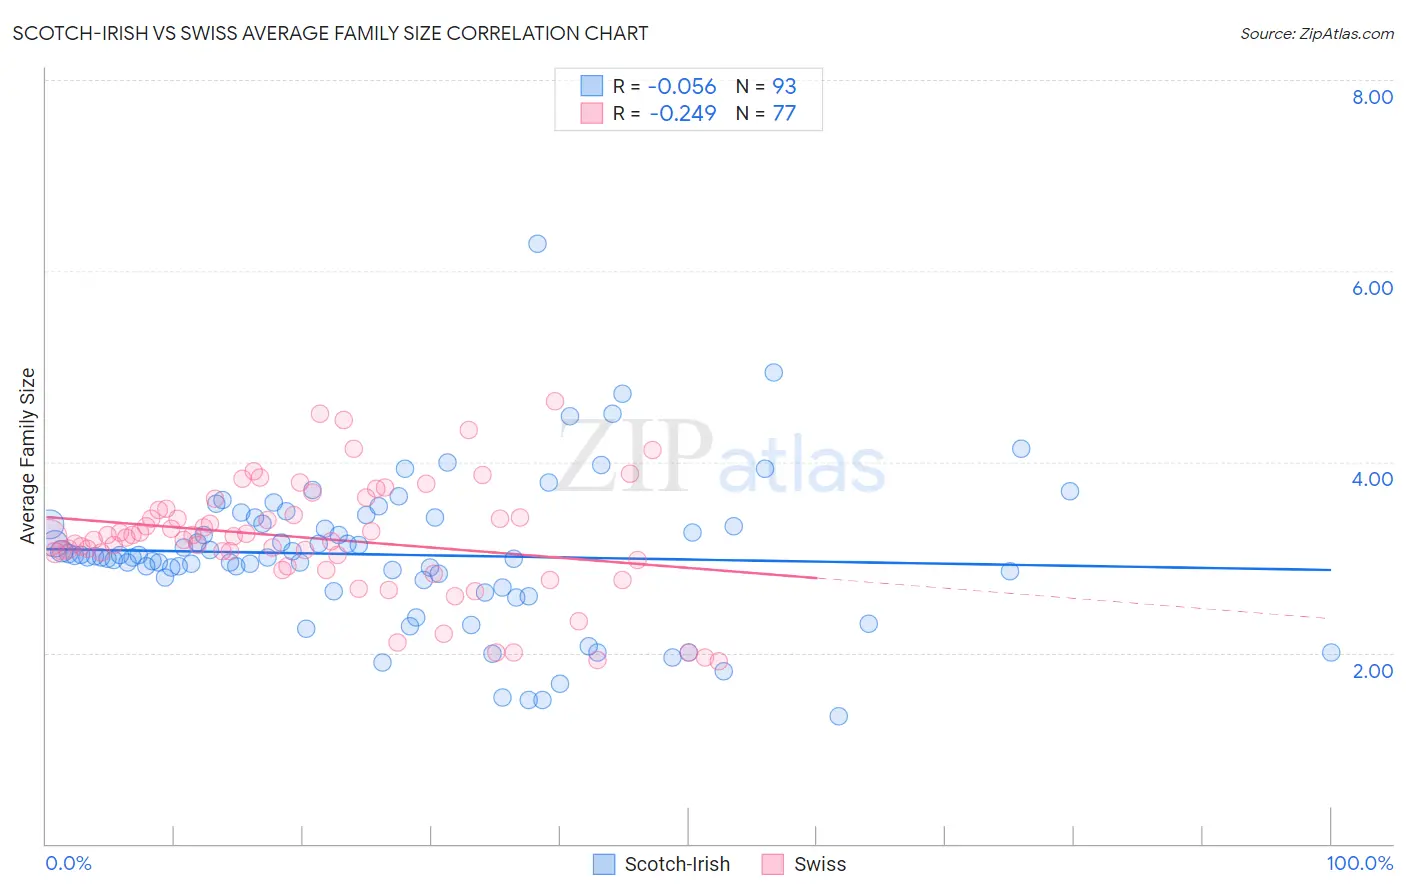
Scotch-Irish vs Swiss Average Family Size Correlation Chart
The statistical analysis conducted on geographies consisting of 548,372,805 people shows a slight negative correlation between the proportion of Scotch-Irish and average family size in the United States with a correlation coefficient (R) of -0.056 and weighted average of 3.11. Similarly, the statistical analysis conducted on geographies consisting of 464,761,483 people shows a weak negative correlation between the proportion of Swiss and average family size in the United States with a correlation coefficient (R) of -0.249 and weighted average of 3.15, a difference of 1.5%.
Average Family Size Correlation Summary
| Measurement | Scotch-Irish | Swiss |
| Minimum | 1.34 | 1.91 |
| Maximum | 6.29 | 4.63 |
| Range | 4.95 | 2.72 |
| Mean | 3.03 | 3.20 |
| Median | 3.00 | 3.21 |
| Interquartile 25% (IQ1) | 2.73 | 2.94 |
| Interquartile 75% (IQ3) | 3.38 | 3.50 |
| Interquartile Range (IQR) | 0.65 | 0.56 |
| Standard Deviation (Sample) | 0.77 | 0.60 |
| Standard Deviation (Population) | 0.77 | 0.60 |
Similar Demographics by Average Family Size
Demographics Similar to Scotch-Irish by Average Family Size
In terms of average family size, the demographic groups most similar to Scotch-Irish are Latvian (3.11, a difference of 0.0%), Scottish (3.11, a difference of 0.0%), Estonian (3.10, a difference of 0.050%), Lithuanian (3.10, a difference of 0.050%), and Belgian (3.11, a difference of 0.060%).
| Demographics | Rating | Rank | Average Family Size |
| Celtics | 0.0 /100 | #324 | Tragic 3.11 |
| English | 0.0 /100 | #325 | Tragic 3.11 |
| Ottawa | 0.0 /100 | #326 | Tragic 3.11 |
| Dutch | 0.0 /100 | #327 | Tragic 3.11 |
| Czechs | 0.0 /100 | #328 | Tragic 3.11 |
| Belgians | 0.0 /100 | #329 | Tragic 3.11 |
| Latvians | 0.0 /100 | #330 | Tragic 3.11 |
| Scotch-Irish | 0.0 /100 | #331 | Tragic 3.11 |
| Scottish | 0.0 /100 | #332 | Tragic 3.11 |
| Estonians | 0.0 /100 | #333 | Tragic 3.10 |
| Lithuanians | 0.0 /100 | #334 | Tragic 3.10 |
| Luxembourgers | 0.0 /100 | #335 | Tragic 3.10 |
| Irish | 0.0 /100 | #336 | Tragic 3.10 |
| Swedes | 0.0 /100 | #337 | Tragic 3.10 |
| French | 0.0 /100 | #338 | Tragic 3.10 |
Demographics Similar to Swiss by Average Family Size
In terms of average family size, the demographic groups most similar to Swiss are Immigrants from Bosnia and Herzegovina (3.15, a difference of 0.010%), Okinawan (3.15, a difference of 0.030%), Immigrants from Europe (3.15, a difference of 0.040%), Immigrants from England (3.15, a difference of 0.070%), and New Zealander (3.15, a difference of 0.10%).
| Demographics | Rating | Rank | Average Family Size |
| Tlingit-Haida | 0.7 /100 | #270 | Tragic 3.16 |
| Immigrants | Germany | 0.7 /100 | #271 | Tragic 3.15 |
| Immigrants | Lithuania | 0.6 /100 | #272 | Tragic 3.15 |
| New Zealanders | 0.6 /100 | #273 | Tragic 3.15 |
| Immigrants | Belgium | 0.6 /100 | #274 | Tragic 3.15 |
| Cambodians | 0.6 /100 | #275 | Tragic 3.15 |
| Immigrants | Bosnia and Herzegovina | 0.5 /100 | #276 | Tragic 3.15 |
| Swiss | 0.5 /100 | #277 | Tragic 3.15 |
| Okinawans | 0.5 /100 | #278 | Tragic 3.15 |
| Immigrants | Europe | 0.5 /100 | #279 | Tragic 3.15 |
| Immigrants | England | 0.4 /100 | #280 | Tragic 3.15 |
| Immigrants | Denmark | 0.4 /100 | #281 | Tragic 3.15 |
| Yugoslavians | 0.4 /100 | #282 | Tragic 3.15 |
| German Russians | 0.4 /100 | #283 | Tragic 3.15 |
| Immigrants | France | 0.4 /100 | #284 | Tragic 3.15 |