Scotch-Irish vs Immigrants from Western Europe Average Family Size
COMPARE
Scotch-Irish
Immigrants from Western Europe
Average Family Size
Average Family Size Comparison
Scotch-Irish
Immigrants from Western Europe
3.11
AVERAGE FAMILY SIZE
0.0/ 100
METRIC RATING
331st/ 347
METRIC RANK
3.14
AVERAGE FAMILY SIZE
0.2/ 100
METRIC RATING
297th/ 347
METRIC RANK
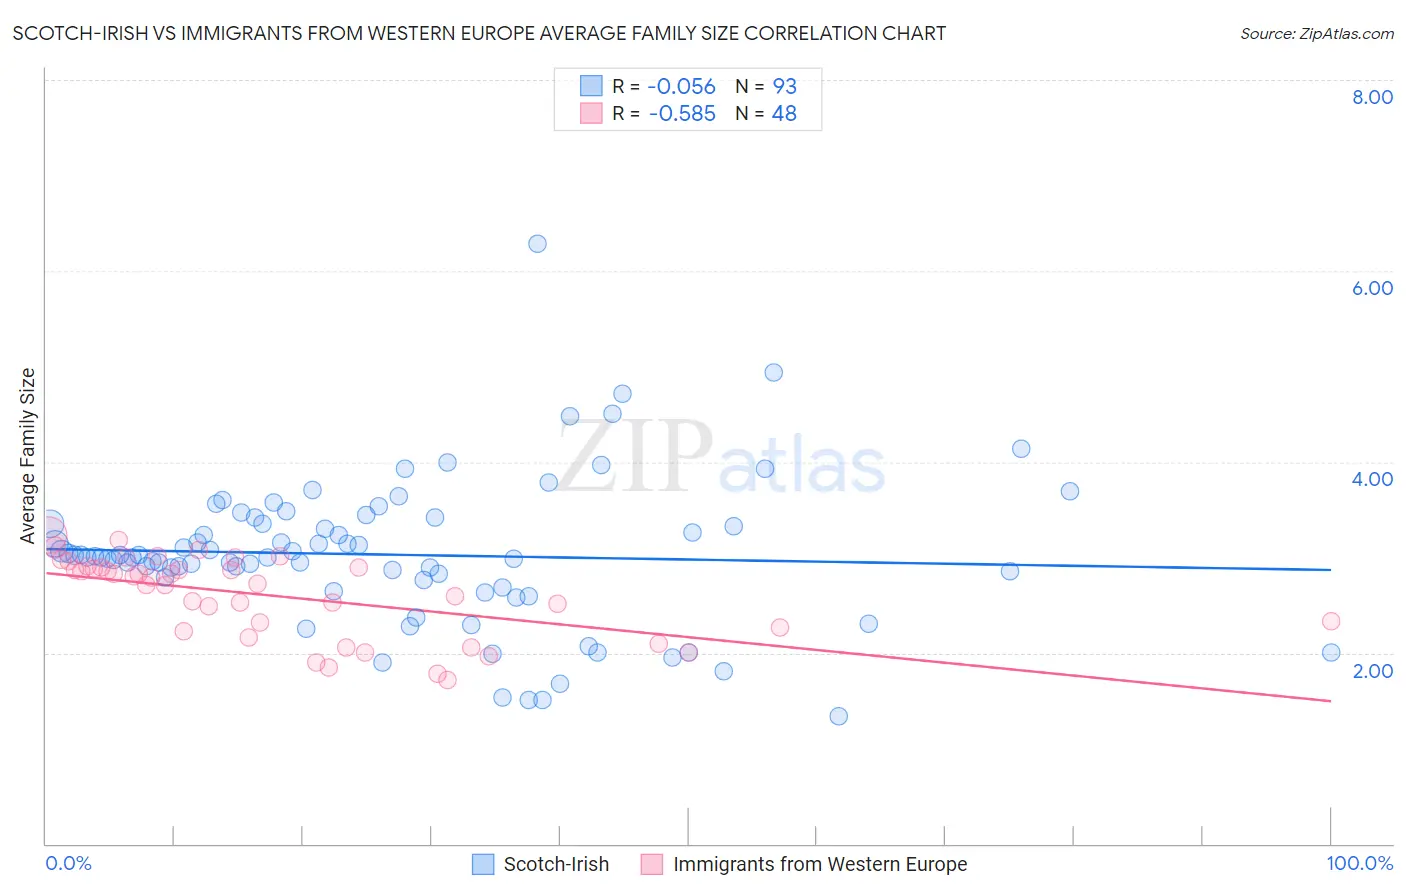
Scotch-Irish vs Immigrants from Western Europe Average Family Size Correlation Chart
The statistical analysis conducted on geographies consisting of 548,372,805 people shows a slight negative correlation between the proportion of Scotch-Irish and average family size in the United States with a correlation coefficient (R) of -0.056 and weighted average of 3.11. Similarly, the statistical analysis conducted on geographies consisting of 493,828,171 people shows a substantial negative correlation between the proportion of Immigrants from Western Europe and average family size in the United States with a correlation coefficient (R) of -0.585 and weighted average of 3.14, a difference of 1.1%.
Average Family Size Correlation Summary
| Measurement | Scotch-Irish | Immigrants from Western Europe |
| Minimum | 1.34 | 1.71 |
| Maximum | 6.29 | 3.23 |
| Range | 4.95 | 1.52 |
| Mean | 3.03 | 2.59 |
| Median | 3.00 | 2.76 |
| Interquartile 25% (IQ1) | 2.73 | 2.25 |
| Interquartile 75% (IQ3) | 3.38 | 2.89 |
| Interquartile Range (IQR) | 0.65 | 0.65 |
| Standard Deviation (Sample) | 0.77 | 0.42 |
| Standard Deviation (Population) | 0.77 | 0.41 |
Similar Demographics by Average Family Size
Demographics Similar to Scotch-Irish by Average Family Size
In terms of average family size, the demographic groups most similar to Scotch-Irish are Latvian (3.11, a difference of 0.0%), Scottish (3.11, a difference of 0.0%), Estonian (3.10, a difference of 0.050%), Lithuanian (3.10, a difference of 0.050%), and Belgian (3.11, a difference of 0.060%).
| Demographics | Rating | Rank | Average Family Size |
| Celtics | 0.0 /100 | #324 | Tragic 3.11 |
| English | 0.0 /100 | #325 | Tragic 3.11 |
| Ottawa | 0.0 /100 | #326 | Tragic 3.11 |
| Dutch | 0.0 /100 | #327 | Tragic 3.11 |
| Czechs | 0.0 /100 | #328 | Tragic 3.11 |
| Belgians | 0.0 /100 | #329 | Tragic 3.11 |
| Latvians | 0.0 /100 | #330 | Tragic 3.11 |
| Scotch-Irish | 0.0 /100 | #331 | Tragic 3.11 |
| Scottish | 0.0 /100 | #332 | Tragic 3.11 |
| Estonians | 0.0 /100 | #333 | Tragic 3.10 |
| Lithuanians | 0.0 /100 | #334 | Tragic 3.10 |
| Luxembourgers | 0.0 /100 | #335 | Tragic 3.10 |
| Irish | 0.0 /100 | #336 | Tragic 3.10 |
| Swedes | 0.0 /100 | #337 | Tragic 3.10 |
| French | 0.0 /100 | #338 | Tragic 3.10 |
Demographics Similar to Immigrants from Western Europe by Average Family Size
In terms of average family size, the demographic groups most similar to Immigrants from Western Europe are Austrian (3.14, a difference of 0.0%), Ukrainian (3.14, a difference of 0.0%), Colville (3.14, a difference of 0.0%), Immigrants from Croatia (3.14, a difference of 0.010%), and Scandinavian (3.14, a difference of 0.030%).
| Demographics | Rating | Rank | Average Family Size |
| Cypriots | 0.3 /100 | #290 | Tragic 3.14 |
| Alsatians | 0.2 /100 | #291 | Tragic 3.14 |
| Europeans | 0.2 /100 | #292 | Tragic 3.14 |
| Scandinavians | 0.2 /100 | #293 | Tragic 3.14 |
| Immigrants | Croatia | 0.2 /100 | #294 | Tragic 3.14 |
| Austrians | 0.2 /100 | #295 | Tragic 3.14 |
| Ukrainians | 0.2 /100 | #296 | Tragic 3.14 |
| Immigrants | Western Europe | 0.2 /100 | #297 | Tragic 3.14 |
| Colville | 0.2 /100 | #298 | Tragic 3.14 |
| Canadians | 0.2 /100 | #299 | Tragic 3.14 |
| Immigrants | Sweden | 0.2 /100 | #300 | Tragic 3.14 |
| Macedonians | 0.2 /100 | #301 | Tragic 3.13 |
| Immigrants | Latvia | 0.2 /100 | #302 | Tragic 3.13 |
| British | 0.2 /100 | #303 | Tragic 3.13 |
| Immigrants | Switzerland | 0.2 /100 | #304 | Tragic 3.13 |