Scotch-Irish vs Swiss Male Disability
COMPARE
Scotch-Irish
Swiss
Male Disability
Male Disability Comparison
Scotch-Irish
Swiss
13.2%
MALE DISABILITY
0.0/ 100
METRIC RATING
303rd/ 347
METRIC RANK
12.1%
MALE DISABILITY
0.3/ 100
METRIC RATING
256th/ 347
METRIC RANK
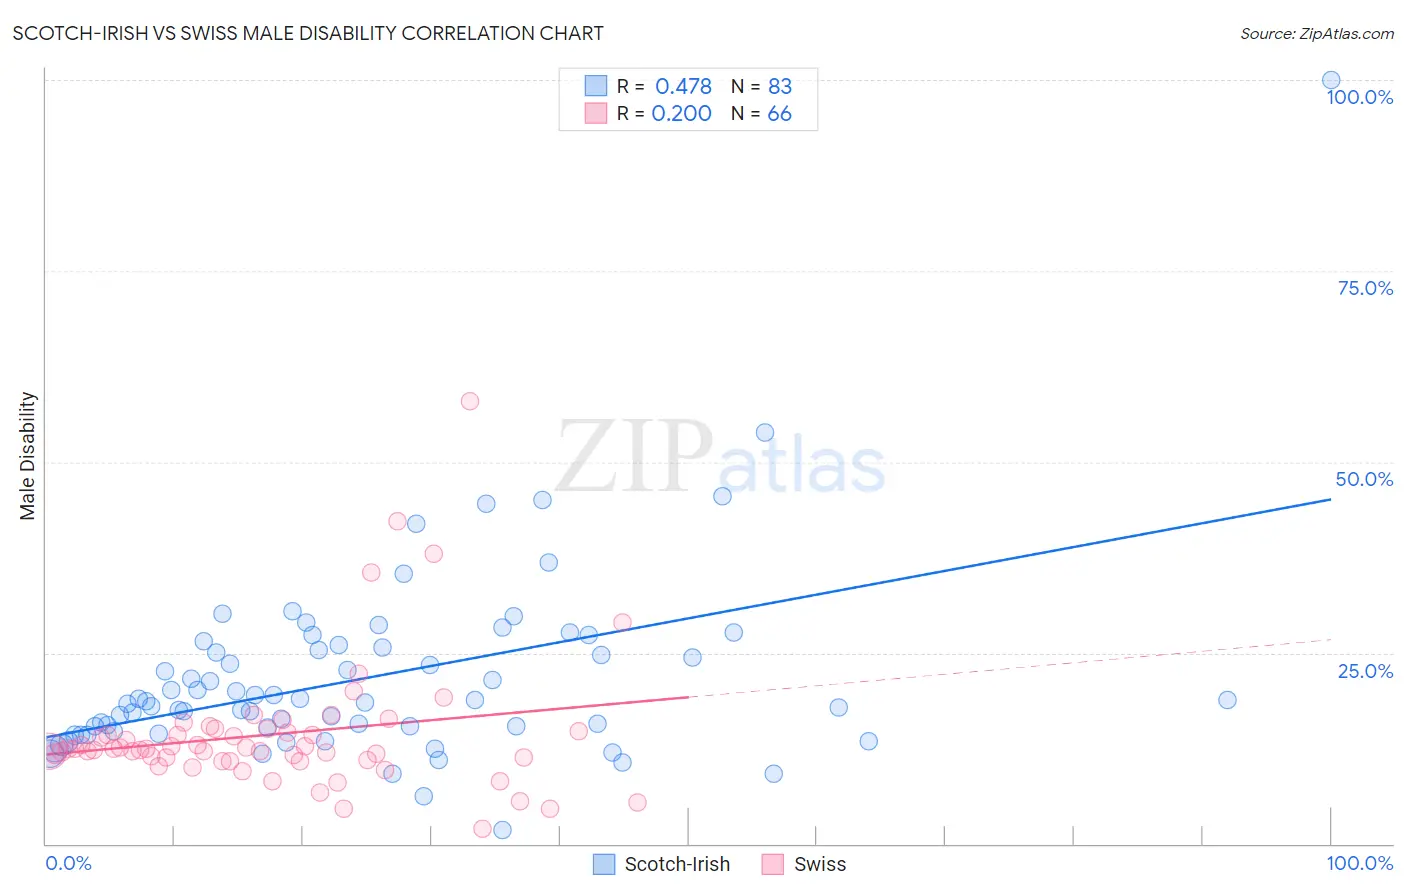
Scotch-Irish vs Swiss Male Disability Correlation Chart
The statistical analysis conducted on geographies consisting of 548,574,277 people shows a moderate positive correlation between the proportion of Scotch-Irish and percentage of males with a disability in the United States with a correlation coefficient (R) of 0.478 and weighted average of 13.2%. Similarly, the statistical analysis conducted on geographies consisting of 464,975,169 people shows a weak positive correlation between the proportion of Swiss and percentage of males with a disability in the United States with a correlation coefficient (R) of 0.200 and weighted average of 12.1%, a difference of 9.0%.
Male Disability Correlation Summary
| Measurement | Scotch-Irish | Swiss |
| Minimum | 1.8% | 2.0% |
| Maximum | 100.0% | 57.9% |
| Range | 98.2% | 55.9% |
| Mean | 21.6% | 14.3% |
| Median | 18.6% | 12.4% |
| Interquartile 25% (IQ1) | 14.8% | 11.0% |
| Interquartile 75% (IQ3) | 25.6% | 14.7% |
| Interquartile Range (IQR) | 10.9% | 3.7% |
| Standard Deviation (Sample) | 12.6% | 8.7% |
| Standard Deviation (Population) | 12.6% | 8.7% |
Similar Demographics by Male Disability
Demographics Similar to Scotch-Irish by Male Disability
In terms of male disability, the demographic groups most similar to Scotch-Irish are Black/African American (13.2%, a difference of 0.32%), Crow (13.1%, a difference of 0.54%), French Canadian (13.3%, a difference of 0.74%), Spanish American (13.3%, a difference of 0.94%), and French (13.0%, a difference of 1.1%).
| Demographics | Rating | Rank | Male Disability |
| Immigrants | Nonimmigrants | 0.0 /100 | #296 | Tragic 12.9% |
| Inupiat | 0.0 /100 | #297 | Tragic 13.0% |
| Pennsylvania Germans | 0.0 /100 | #298 | Tragic 13.0% |
| Celtics | 0.0 /100 | #299 | Tragic 13.0% |
| Cheyenne | 0.0 /100 | #300 | Tragic 13.0% |
| French | 0.0 /100 | #301 | Tragic 13.0% |
| Crow | 0.0 /100 | #302 | Tragic 13.1% |
| Scotch-Irish | 0.0 /100 | #303 | Tragic 13.2% |
| Blacks/African Americans | 0.0 /100 | #304 | Tragic 13.2% |
| French Canadians | 0.0 /100 | #305 | Tragic 13.3% |
| Spanish Americans | 0.0 /100 | #306 | Tragic 13.3% |
| Arapaho | 0.0 /100 | #307 | Tragic 13.3% |
| French American Indians | 0.0 /100 | #308 | Tragic 13.4% |
| Blackfeet | 0.0 /100 | #309 | Tragic 13.4% |
| Immigrants | Azores | 0.0 /100 | #310 | Tragic 13.4% |
Demographics Similar to Swiss by Male Disability
In terms of male disability, the demographic groups most similar to Swiss are European (12.1%, a difference of 0.0%), Basque (12.1%, a difference of 0.19%), Belgian (12.1%, a difference of 0.24%), Chinese (12.1%, a difference of 0.25%), and British (12.1%, a difference of 0.26%).
| Demographics | Rating | Rank | Male Disability |
| Immigrants | Yemen | 0.5 /100 | #249 | Tragic 12.0% |
| Bangladeshis | 0.5 /100 | #250 | Tragic 12.0% |
| German Russians | 0.5 /100 | #251 | Tragic 12.0% |
| Slovenes | 0.5 /100 | #252 | Tragic 12.0% |
| Guamanians/Chamorros | 0.5 /100 | #253 | Tragic 12.0% |
| British | 0.4 /100 | #254 | Tragic 12.1% |
| Chinese | 0.4 /100 | #255 | Tragic 12.1% |
| Swiss | 0.3 /100 | #256 | Tragic 12.1% |
| Europeans | 0.3 /100 | #257 | Tragic 12.1% |
| Basques | 0.3 /100 | #258 | Tragic 12.1% |
| Belgians | 0.3 /100 | #259 | Tragic 12.1% |
| Swedes | 0.3 /100 | #260 | Tragic 12.1% |
| Slavs | 0.2 /100 | #261 | Tragic 12.2% |
| Norwegians | 0.2 /100 | #262 | Tragic 12.2% |
| Canadians | 0.2 /100 | #263 | Tragic 12.2% |