Scotch-Irish vs Immigrants from Central America Average Family Size
COMPARE
Scotch-Irish
Immigrants from Central America
Average Family Size
Average Family Size Comparison
Scotch-Irish
Immigrants from Central America
3.11
AVERAGE FAMILY SIZE
0.0/ 100
METRIC RATING
331st/ 347
METRIC RANK
3.49
AVERAGE FAMILY SIZE
100.0/ 100
METRIC RATING
14th/ 347
METRIC RANK
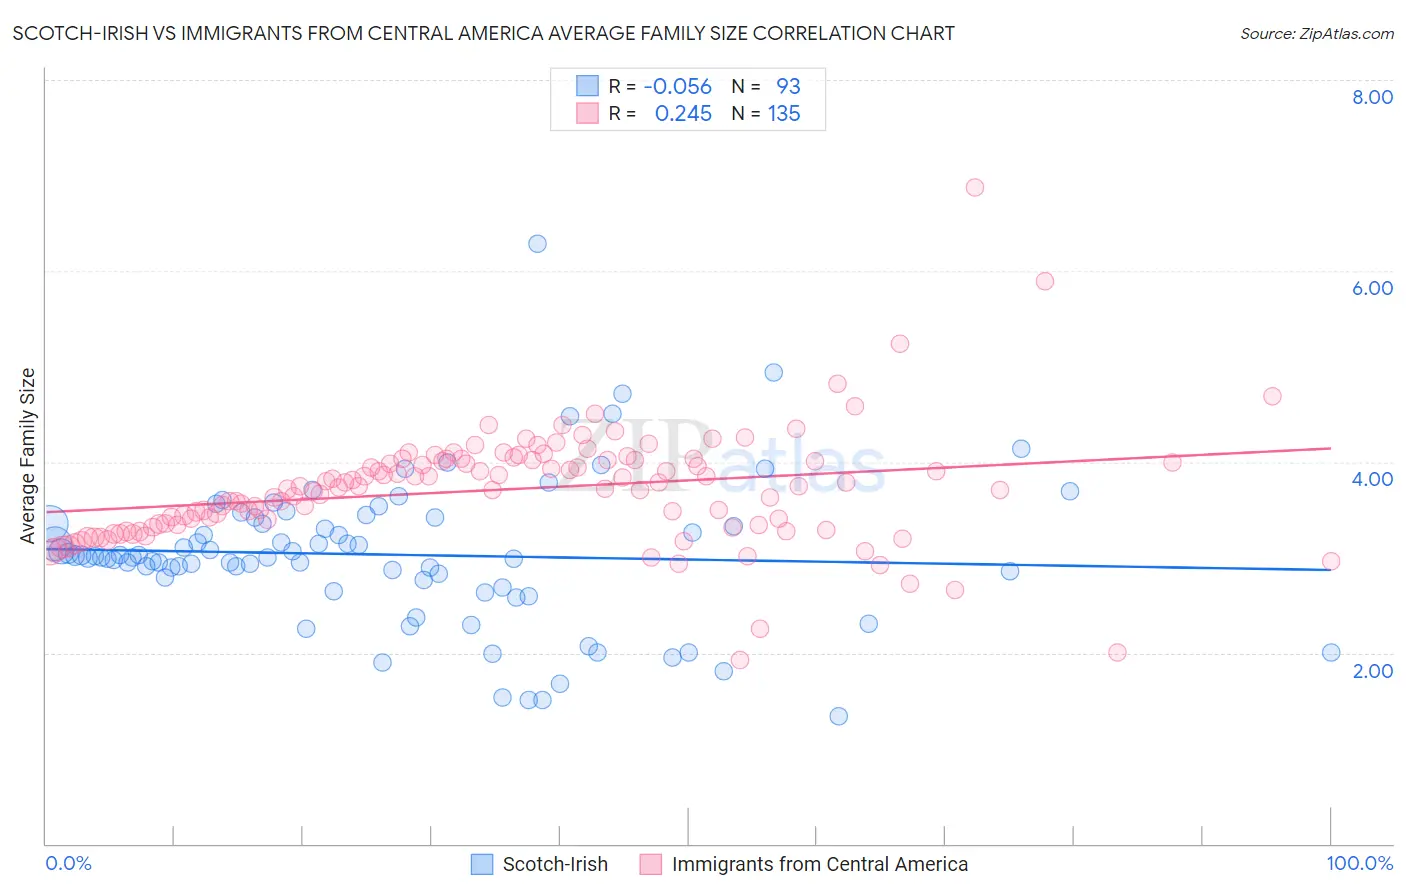
Scotch-Irish vs Immigrants from Central America Average Family Size Correlation Chart
The statistical analysis conducted on geographies consisting of 548,372,805 people shows a slight negative correlation between the proportion of Scotch-Irish and average family size in the United States with a correlation coefficient (R) of -0.056 and weighted average of 3.11. Similarly, the statistical analysis conducted on geographies consisting of 536,085,955 people shows a weak positive correlation between the proportion of Immigrants from Central America and average family size in the United States with a correlation coefficient (R) of 0.245 and weighted average of 3.49, a difference of 12.5%.
Average Family Size Correlation Summary
| Measurement | Scotch-Irish | Immigrants from Central America |
| Minimum | 1.34 | 1.92 |
| Maximum | 6.29 | 6.88 |
| Range | 4.95 | 4.96 |
| Mean | 3.03 | 3.71 |
| Median | 3.00 | 3.74 |
| Interquartile 25% (IQ1) | 2.73 | 3.34 |
| Interquartile 75% (IQ3) | 3.38 | 4.02 |
| Interquartile Range (IQR) | 0.65 | 0.68 |
| Standard Deviation (Sample) | 0.77 | 0.60 |
| Standard Deviation (Population) | 0.77 | 0.60 |
Similar Demographics by Average Family Size
Demographics Similar to Scotch-Irish by Average Family Size
In terms of average family size, the demographic groups most similar to Scotch-Irish are Latvian (3.11, a difference of 0.0%), Scottish (3.11, a difference of 0.0%), Estonian (3.10, a difference of 0.050%), Lithuanian (3.10, a difference of 0.050%), and Belgian (3.11, a difference of 0.060%).
| Demographics | Rating | Rank | Average Family Size |
| Celtics | 0.0 /100 | #324 | Tragic 3.11 |
| English | 0.0 /100 | #325 | Tragic 3.11 |
| Ottawa | 0.0 /100 | #326 | Tragic 3.11 |
| Dutch | 0.0 /100 | #327 | Tragic 3.11 |
| Czechs | 0.0 /100 | #328 | Tragic 3.11 |
| Belgians | 0.0 /100 | #329 | Tragic 3.11 |
| Latvians | 0.0 /100 | #330 | Tragic 3.11 |
| Scotch-Irish | 0.0 /100 | #331 | Tragic 3.11 |
| Scottish | 0.0 /100 | #332 | Tragic 3.11 |
| Estonians | 0.0 /100 | #333 | Tragic 3.10 |
| Lithuanians | 0.0 /100 | #334 | Tragic 3.10 |
| Luxembourgers | 0.0 /100 | #335 | Tragic 3.10 |
| Irish | 0.0 /100 | #336 | Tragic 3.10 |
| Swedes | 0.0 /100 | #337 | Tragic 3.10 |
| French | 0.0 /100 | #338 | Tragic 3.10 |
Demographics Similar to Immigrants from Central America by Average Family Size
In terms of average family size, the demographic groups most similar to Immigrants from Central America are Tongan (3.49, a difference of 0.050%), Ute (3.49, a difference of 0.11%), Immigrants from El Salvador (3.49, a difference of 0.19%), Salvadoran (3.48, a difference of 0.44%), and Mexican (3.48, a difference of 0.51%).
| Demographics | Rating | Rank | Average Family Size |
| Inupiat | 100.0 /100 | #7 | Exceptional 3.63 |
| Immigrants | Yemen | 100.0 /100 | #8 | Exceptional 3.60 |
| Hopi | 100.0 /100 | #9 | Exceptional 3.60 |
| Spanish American Indians | 100.0 /100 | #10 | Exceptional 3.58 |
| Tohono O'odham | 100.0 /100 | #11 | Exceptional 3.53 |
| Immigrants | Mexico | 100.0 /100 | #12 | Exceptional 3.52 |
| Sioux | 100.0 /100 | #13 | Exceptional 3.52 |
| Immigrants | Central America | 100.0 /100 | #14 | Exceptional 3.49 |
| Tongans | 100.0 /100 | #15 | Exceptional 3.49 |
| Ute | 100.0 /100 | #16 | Exceptional 3.49 |
| Immigrants | El Salvador | 100.0 /100 | #17 | Exceptional 3.49 |
| Salvadorans | 100.0 /100 | #18 | Exceptional 3.48 |
| Mexicans | 100.0 /100 | #19 | Exceptional 3.48 |
| Cheyenne | 100.0 /100 | #20 | Exceptional 3.47 |
| Yuman | 100.0 /100 | #21 | Exceptional 3.47 |