Scotch-Irish vs Cajun Average Family Size
COMPARE
Scotch-Irish
Cajun
Average Family Size
Average Family Size Comparison
Scotch-Irish
Cajuns
3.11
AVERAGE FAMILY SIZE
0.0/ 100
METRIC RATING
331st/ 347
METRIC RANK
3.17
AVERAGE FAMILY SIZE
2.4/ 100
METRIC RATING
247th/ 347
METRIC RANK
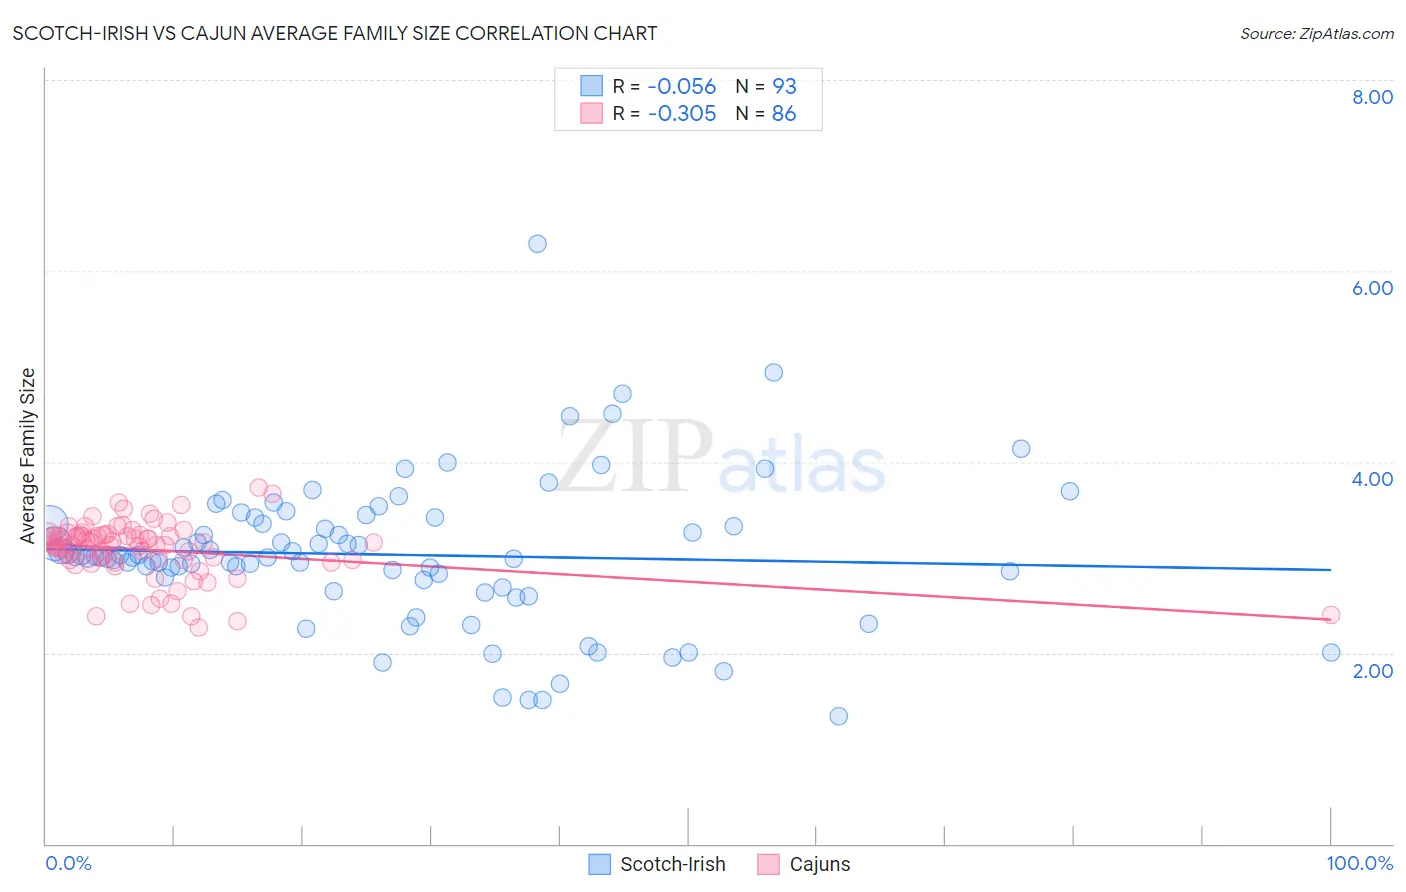
Scotch-Irish vs Cajun Average Family Size Correlation Chart
The statistical analysis conducted on geographies consisting of 548,372,805 people shows a slight negative correlation between the proportion of Scotch-Irish and average family size in the United States with a correlation coefficient (R) of -0.056 and weighted average of 3.11. Similarly, the statistical analysis conducted on geographies consisting of 149,695,466 people shows a mild negative correlation between the proportion of Cajuns and average family size in the United States with a correlation coefficient (R) of -0.305 and weighted average of 3.17, a difference of 2.2%.
Average Family Size Correlation Summary
| Measurement | Scotch-Irish | Cajun |
| Minimum | 1.34 | 2.26 |
| Maximum | 6.29 | 3.73 |
| Range | 4.95 | 1.47 |
| Mean | 3.03 | 3.08 |
| Median | 3.00 | 3.14 |
| Interquartile 25% (IQ1) | 2.73 | 2.97 |
| Interquartile 75% (IQ3) | 3.38 | 3.23 |
| Interquartile Range (IQR) | 0.65 | 0.26 |
| Standard Deviation (Sample) | 0.77 | 0.30 |
| Standard Deviation (Population) | 0.77 | 0.29 |
Similar Demographics by Average Family Size
Demographics Similar to Scotch-Irish by Average Family Size
In terms of average family size, the demographic groups most similar to Scotch-Irish are Latvian (3.11, a difference of 0.0%), Scottish (3.11, a difference of 0.0%), Estonian (3.10, a difference of 0.050%), Lithuanian (3.10, a difference of 0.050%), and Belgian (3.11, a difference of 0.060%).
| Demographics | Rating | Rank | Average Family Size |
| Celtics | 0.0 /100 | #324 | Tragic 3.11 |
| English | 0.0 /100 | #325 | Tragic 3.11 |
| Ottawa | 0.0 /100 | #326 | Tragic 3.11 |
| Dutch | 0.0 /100 | #327 | Tragic 3.11 |
| Czechs | 0.0 /100 | #328 | Tragic 3.11 |
| Belgians | 0.0 /100 | #329 | Tragic 3.11 |
| Latvians | 0.0 /100 | #330 | Tragic 3.11 |
| Scotch-Irish | 0.0 /100 | #331 | Tragic 3.11 |
| Scottish | 0.0 /100 | #332 | Tragic 3.11 |
| Estonians | 0.0 /100 | #333 | Tragic 3.10 |
| Lithuanians | 0.0 /100 | #334 | Tragic 3.10 |
| Luxembourgers | 0.0 /100 | #335 | Tragic 3.10 |
| Irish | 0.0 /100 | #336 | Tragic 3.10 |
| Swedes | 0.0 /100 | #337 | Tragic 3.10 |
| French | 0.0 /100 | #338 | Tragic 3.10 |
Demographics Similar to Cajuns by Average Family Size
In terms of average family size, the demographic groups most similar to Cajuns are Danish (3.17, a difference of 0.010%), Immigrants from Belarus (3.17, a difference of 0.030%), Immigrants from Brazil (3.18, a difference of 0.050%), Immigrants from Eastern Europe (3.17, a difference of 0.070%), and Immigrants from Southern Europe (3.18, a difference of 0.080%).
| Demographics | Rating | Rank | Average Family Size |
| Osage | 3.2 /100 | #240 | Tragic 3.18 |
| Immigrants | Japan | 3.0 /100 | #241 | Tragic 3.18 |
| Hungarians | 3.0 /100 | #242 | Tragic 3.18 |
| Immigrants | Moldova | 2.9 /100 | #243 | Tragic 3.18 |
| Immigrants | Southern Europe | 2.9 /100 | #244 | Tragic 3.18 |
| Immigrants | Brazil | 2.7 /100 | #245 | Tragic 3.18 |
| Danes | 2.5 /100 | #246 | Tragic 3.17 |
| Cajuns | 2.4 /100 | #247 | Tragic 3.17 |
| Immigrants | Belarus | 2.3 /100 | #248 | Tragic 3.17 |
| Immigrants | Eastern Europe | 2.1 /100 | #249 | Tragic 3.17 |
| Puget Sound Salish | 1.9 /100 | #250 | Tragic 3.17 |
| Immigrants | Spain | 1.8 /100 | #251 | Tragic 3.17 |
| Immigrants | Saudi Arabia | 1.7 /100 | #252 | Tragic 3.17 |
| South Africans | 1.7 /100 | #253 | Tragic 3.17 |
| Immigrants | Hungary | 1.7 /100 | #254 | Tragic 3.17 |