Scotch-Irish vs Nonimmigrants Average Family Size
COMPARE
Scotch-Irish
Nonimmigrants
Average Family Size
Average Family Size Comparison
Scotch-Irish
Nonimmigrants
3.11
AVERAGE FAMILY SIZE
0.0/ 100
METRIC RATING
331st/ 347
METRIC RANK
3.19
AVERAGE FAMILY SIZE
5.7/ 100
METRIC RATING
228th/ 347
METRIC RANK
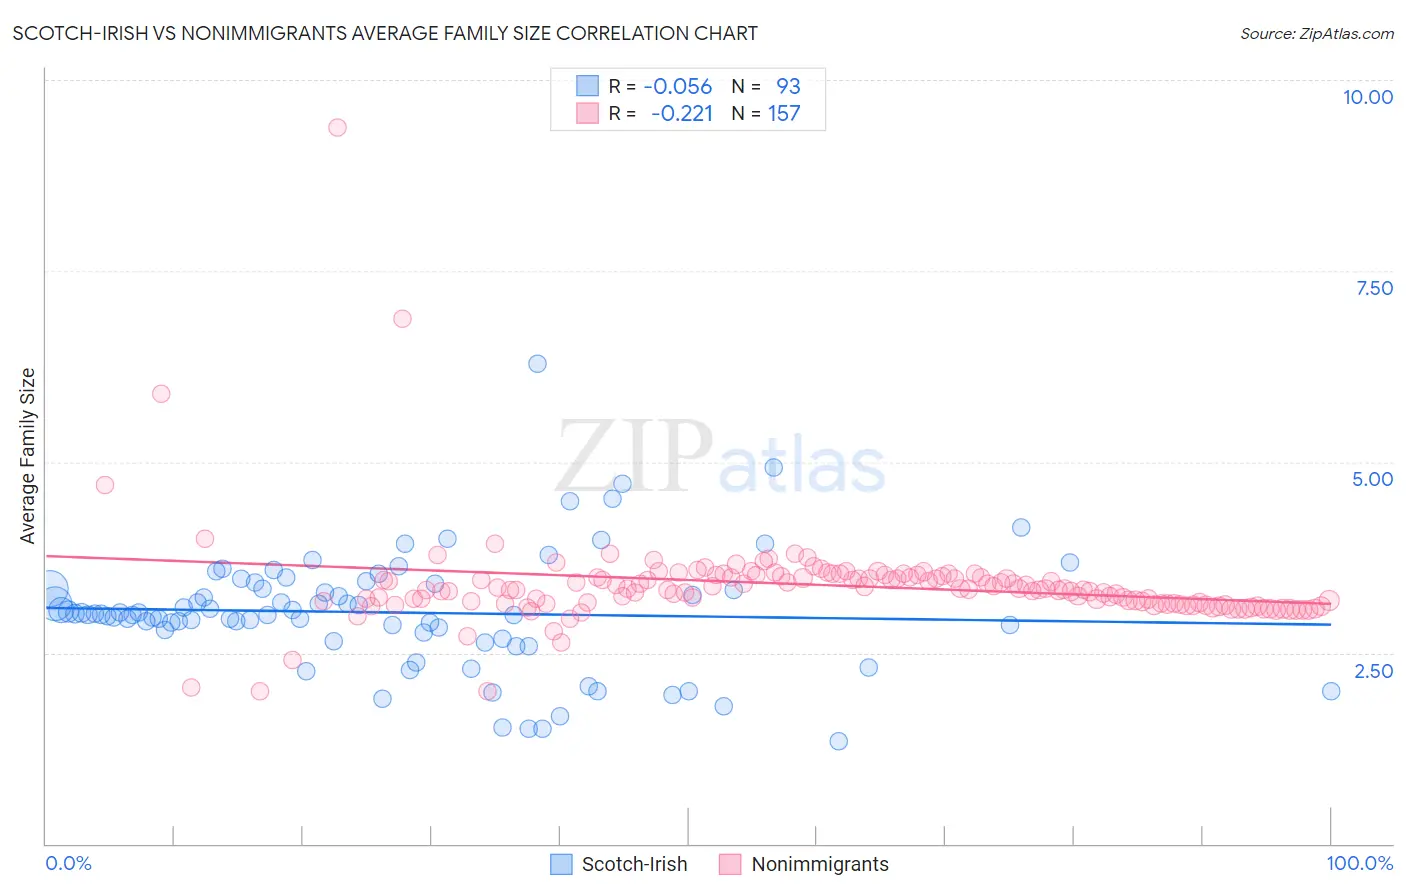
Scotch-Irish vs Nonimmigrants Average Family Size Correlation Chart
The statistical analysis conducted on geographies consisting of 548,372,805 people shows a slight negative correlation between the proportion of Scotch-Irish and average family size in the United States with a correlation coefficient (R) of -0.056 and weighted average of 3.11. Similarly, the statistical analysis conducted on geographies consisting of 584,651,869 people shows a weak negative correlation between the proportion of Nonimmigrants and average family size in the United States with a correlation coefficient (R) of -0.221 and weighted average of 3.19, a difference of 2.6%.
Average Family Size Correlation Summary
| Measurement | Scotch-Irish | Nonimmigrants |
| Minimum | 1.34 | 2.00 |
| Maximum | 6.29 | 9.38 |
| Range | 4.95 | 7.38 |
| Mean | 3.03 | 3.39 |
| Median | 3.00 | 3.33 |
| Interquartile 25% (IQ1) | 2.73 | 3.14 |
| Interquartile 75% (IQ3) | 3.38 | 3.50 |
| Interquartile Range (IQR) | 0.65 | 0.36 |
| Standard Deviation (Sample) | 0.77 | 0.67 |
| Standard Deviation (Population) | 0.77 | 0.67 |
Similar Demographics by Average Family Size
Demographics Similar to Scotch-Irish by Average Family Size
In terms of average family size, the demographic groups most similar to Scotch-Irish are Latvian (3.11, a difference of 0.0%), Scottish (3.11, a difference of 0.0%), Estonian (3.10, a difference of 0.050%), Lithuanian (3.10, a difference of 0.050%), and Belgian (3.11, a difference of 0.060%).
| Demographics | Rating | Rank | Average Family Size |
| Celtics | 0.0 /100 | #324 | Tragic 3.11 |
| English | 0.0 /100 | #325 | Tragic 3.11 |
| Ottawa | 0.0 /100 | #326 | Tragic 3.11 |
| Dutch | 0.0 /100 | #327 | Tragic 3.11 |
| Czechs | 0.0 /100 | #328 | Tragic 3.11 |
| Belgians | 0.0 /100 | #329 | Tragic 3.11 |
| Latvians | 0.0 /100 | #330 | Tragic 3.11 |
| Scotch-Irish | 0.0 /100 | #331 | Tragic 3.11 |
| Scottish | 0.0 /100 | #332 | Tragic 3.11 |
| Estonians | 0.0 /100 | #333 | Tragic 3.10 |
| Lithuanians | 0.0 /100 | #334 | Tragic 3.10 |
| Luxembourgers | 0.0 /100 | #335 | Tragic 3.10 |
| Irish | 0.0 /100 | #336 | Tragic 3.10 |
| Swedes | 0.0 /100 | #337 | Tragic 3.10 |
| French | 0.0 /100 | #338 | Tragic 3.10 |
Demographics Similar to Nonimmigrants by Average Family Size
In terms of average family size, the demographic groups most similar to Nonimmigrants are Portuguese (3.19, a difference of 0.020%), Chickasaw (3.19, a difference of 0.030%), Cree (3.19, a difference of 0.040%), Immigrants from Italy (3.19, a difference of 0.040%), and Icelander (3.19, a difference of 0.050%).
| Demographics | Rating | Rank | Average Family Size |
| Immigrants | Ukraine | 7.2 /100 | #221 | Tragic 3.19 |
| Immigrants | Kuwait | 7.2 /100 | #222 | Tragic 3.19 |
| Immigrants | Zimbabwe | 7.1 /100 | #223 | Tragic 3.19 |
| Syrians | 6.5 /100 | #224 | Tragic 3.19 |
| Cree | 6.2 /100 | #225 | Tragic 3.19 |
| Chickasaw | 6.0 /100 | #226 | Tragic 3.19 |
| Portuguese | 6.0 /100 | #227 | Tragic 3.19 |
| Immigrants | Nonimmigrants | 5.7 /100 | #228 | Tragic 3.19 |
| Immigrants | Italy | 5.3 /100 | #229 | Tragic 3.19 |
| Icelanders | 5.2 /100 | #230 | Tragic 3.19 |
| Basques | 5.2 /100 | #231 | Tragic 3.19 |
| Cherokee | 4.7 /100 | #232 | Tragic 3.18 |
| Brazilians | 4.5 /100 | #233 | Tragic 3.18 |
| Iranians | 4.5 /100 | #234 | Tragic 3.18 |
| Immigrants | Turkey | 4.2 /100 | #235 | Tragic 3.18 |