Scotch-Irish vs Immigrants from Congo Average Family Size
COMPARE
Scotch-Irish
Immigrants from Congo
Average Family Size
Average Family Size Comparison
Scotch-Irish
Immigrants from Congo
3.11
AVERAGE FAMILY SIZE
0.0/ 100
METRIC RATING
331st/ 347
METRIC RANK
3.23
AVERAGE FAMILY SIZE
52.7/ 100
METRIC RATING
172nd/ 347
METRIC RANK
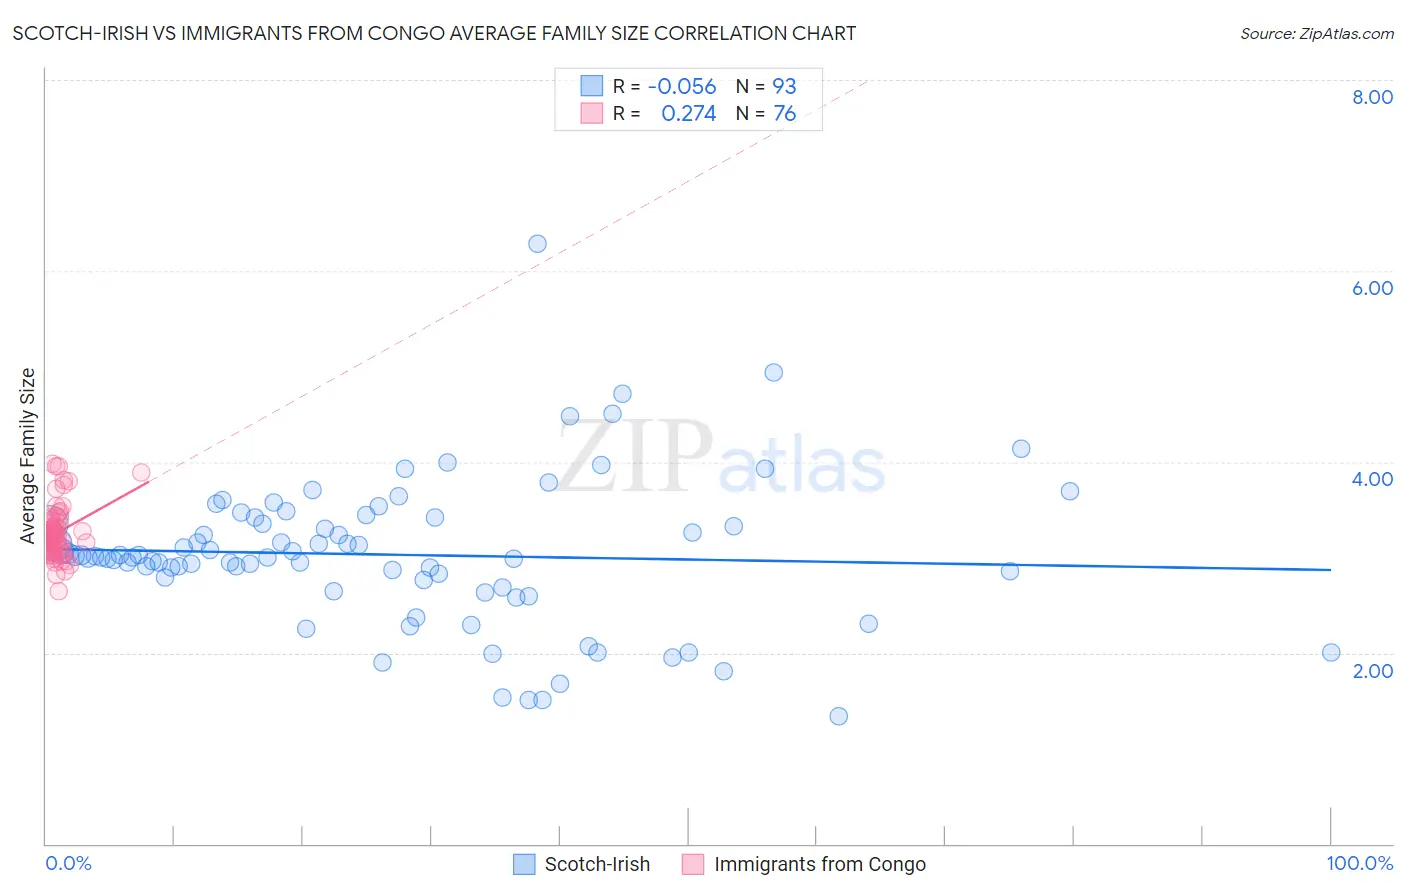
Scotch-Irish vs Immigrants from Congo Average Family Size Correlation Chart
The statistical analysis conducted on geographies consisting of 548,372,805 people shows a slight negative correlation between the proportion of Scotch-Irish and average family size in the United States with a correlation coefficient (R) of -0.056 and weighted average of 3.11. Similarly, the statistical analysis conducted on geographies consisting of 92,087,751 people shows a weak positive correlation between the proportion of Immigrants from Congo and average family size in the United States with a correlation coefficient (R) of 0.274 and weighted average of 3.23, a difference of 4.0%.
Average Family Size Correlation Summary
| Measurement | Scotch-Irish | Immigrants from Congo |
| Minimum | 1.34 | 2.65 |
| Maximum | 6.29 | 3.97 |
| Range | 4.95 | 1.32 |
| Mean | 3.03 | 3.25 |
| Median | 3.00 | 3.21 |
| Interquartile 25% (IQ1) | 2.73 | 3.09 |
| Interquartile 75% (IQ3) | 3.38 | 3.32 |
| Interquartile Range (IQR) | 0.65 | 0.23 |
| Standard Deviation (Sample) | 0.77 | 0.26 |
| Standard Deviation (Population) | 0.77 | 0.26 |
Similar Demographics by Average Family Size
Demographics Similar to Scotch-Irish by Average Family Size
In terms of average family size, the demographic groups most similar to Scotch-Irish are Latvian (3.11, a difference of 0.0%), Scottish (3.11, a difference of 0.0%), Estonian (3.10, a difference of 0.050%), Lithuanian (3.10, a difference of 0.050%), and Belgian (3.11, a difference of 0.060%).
| Demographics | Rating | Rank | Average Family Size |
| Celtics | 0.0 /100 | #324 | Tragic 3.11 |
| English | 0.0 /100 | #325 | Tragic 3.11 |
| Ottawa | 0.0 /100 | #326 | Tragic 3.11 |
| Dutch | 0.0 /100 | #327 | Tragic 3.11 |
| Czechs | 0.0 /100 | #328 | Tragic 3.11 |
| Belgians | 0.0 /100 | #329 | Tragic 3.11 |
| Latvians | 0.0 /100 | #330 | Tragic 3.11 |
| Scotch-Irish | 0.0 /100 | #331 | Tragic 3.11 |
| Scottish | 0.0 /100 | #332 | Tragic 3.11 |
| Estonians | 0.0 /100 | #333 | Tragic 3.10 |
| Lithuanians | 0.0 /100 | #334 | Tragic 3.10 |
| Luxembourgers | 0.0 /100 | #335 | Tragic 3.10 |
| Irish | 0.0 /100 | #336 | Tragic 3.10 |
| Swedes | 0.0 /100 | #337 | Tragic 3.10 |
| French | 0.0 /100 | #338 | Tragic 3.10 |
Demographics Similar to Immigrants from Congo by Average Family Size
In terms of average family size, the demographic groups most similar to Immigrants from Congo are Chilean (3.23, a difference of 0.010%), Immigrants from Uruguay (3.23, a difference of 0.010%), Arab (3.23, a difference of 0.020%), Taiwanese (3.23, a difference of 0.030%), and Aleut (3.23, a difference of 0.030%).
| Demographics | Rating | Rank | Average Family Size |
| Ugandans | 58.4 /100 | #165 | Average 3.23 |
| Immigrants | Senegal | 57.5 /100 | #166 | Average 3.23 |
| Dutch West Indians | 56.9 /100 | #167 | Average 3.23 |
| Taiwanese | 54.2 /100 | #168 | Average 3.23 |
| Aleuts | 54.1 /100 | #169 | Average 3.23 |
| Arabs | 53.8 /100 | #170 | Average 3.23 |
| Chileans | 53.2 /100 | #171 | Average 3.23 |
| Immigrants | Congo | 52.7 /100 | #172 | Average 3.23 |
| Immigrants | Uruguay | 52.0 /100 | #173 | Average 3.23 |
| Immigrants | South Central Asia | 50.0 /100 | #174 | Average 3.23 |
| Immigrants | China | 49.9 /100 | #175 | Average 3.23 |
| Israelis | 48.7 /100 | #176 | Average 3.23 |
| Argentineans | 47.4 /100 | #177 | Average 3.23 |
| Spaniards | 47.2 /100 | #178 | Average 3.23 |
| Immigrants | Korea | 46.9 /100 | #179 | Average 3.23 |