Immigrants from North Macedonia vs Swiss Average Family Size
COMPARE
Immigrants from North Macedonia
Swiss
Average Family Size
Average Family Size Comparison
Immigrants from North Macedonia
Swiss
3.16
AVERAGE FAMILY SIZE
1.3/ 100
METRIC RATING
261st/ 347
METRIC RANK
3.15
AVERAGE FAMILY SIZE
0.5/ 100
METRIC RATING
277th/ 347
METRIC RANK
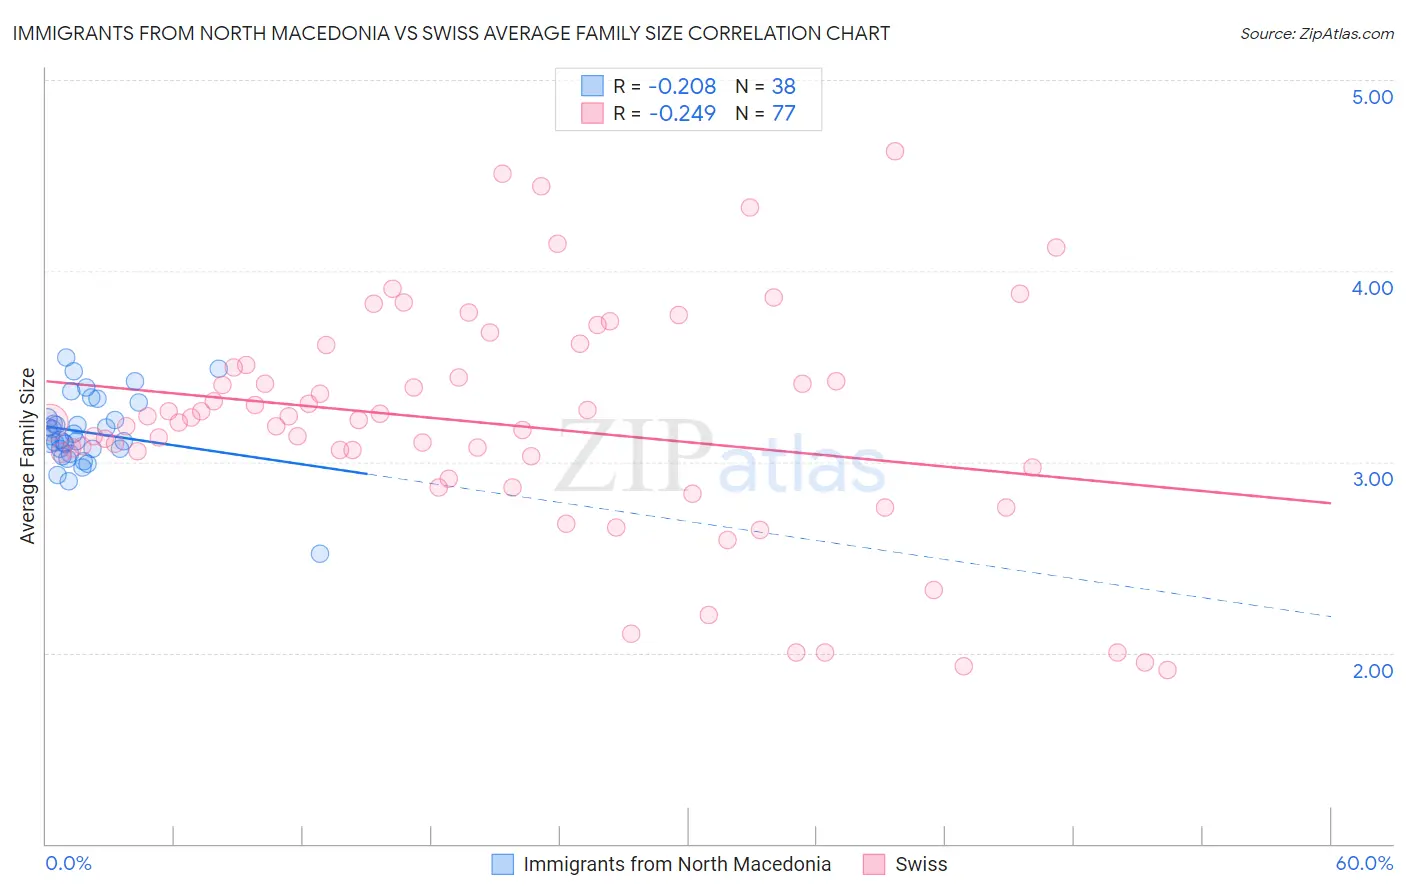
Immigrants from North Macedonia vs Swiss Average Family Size Correlation Chart
The statistical analysis conducted on geographies consisting of 74,306,697 people shows a weak negative correlation between the proportion of Immigrants from North Macedonia and average family size in the United States with a correlation coefficient (R) of -0.208 and weighted average of 3.16. Similarly, the statistical analysis conducted on geographies consisting of 464,761,483 people shows a weak negative correlation between the proportion of Swiss and average family size in the United States with a correlation coefficient (R) of -0.249 and weighted average of 3.15, a difference of 0.44%.
Average Family Size Correlation Summary
| Measurement | Immigrants from North Macedonia | Swiss |
| Minimum | 2.52 | 1.91 |
| Maximum | 3.55 | 4.63 |
| Range | 1.03 | 2.72 |
| Mean | 3.15 | 3.20 |
| Median | 3.13 | 3.21 |
| Interquartile 25% (IQ1) | 3.07 | 2.94 |
| Interquartile 75% (IQ3) | 3.23 | 3.50 |
| Interquartile Range (IQR) | 0.16 | 0.56 |
| Standard Deviation (Sample) | 0.19 | 0.60 |
| Standard Deviation (Population) | 0.19 | 0.60 |
Demographics Similar to Immigrants from North Macedonia and Swiss by Average Family Size
In terms of average family size, the demographic groups most similar to Immigrants from North Macedonia are Potawatomi (3.16, a difference of 0.010%), Immigrants from Albania (3.16, a difference of 0.010%), Immigrants from Russia (3.16, a difference of 0.010%), Immigrants from Bulgaria (3.16, a difference of 0.10%), and American (3.16, a difference of 0.12%). Similarly, the demographic groups most similar to Swiss are Immigrants from Bosnia and Herzegovina (3.15, a difference of 0.010%), Okinawan (3.15, a difference of 0.030%), Immigrants from Europe (3.15, a difference of 0.040%), New Zealander (3.15, a difference of 0.10%), and Immigrants from Belgium (3.15, a difference of 0.10%).
| Demographics | Rating | Rank | Average Family Size |
| Potawatomi | 1.3 /100 | #259 | Tragic 3.16 |
| Immigrants | Albania | 1.3 /100 | #260 | Tragic 3.16 |
| Immigrants | North Macedonia | 1.3 /100 | #261 | Tragic 3.16 |
| Immigrants | Russia | 1.3 /100 | #262 | Tragic 3.16 |
| Immigrants | Bulgaria | 1.0 /100 | #263 | Tragic 3.16 |
| Americans | 1.0 /100 | #264 | Tragic 3.16 |
| Immigrants | South Africa | 0.9 /100 | #265 | Tragic 3.16 |
| Immigrants | Greece | 0.9 /100 | #266 | Tragic 3.16 |
| Iroquois | 0.8 /100 | #267 | Tragic 3.16 |
| Maltese | 0.8 /100 | #268 | Tragic 3.16 |
| Immigrants | Singapore | 0.7 /100 | #269 | Tragic 3.16 |
| Tlingit-Haida | 0.7 /100 | #270 | Tragic 3.16 |
| Immigrants | Germany | 0.7 /100 | #271 | Tragic 3.15 |
| Immigrants | Lithuania | 0.6 /100 | #272 | Tragic 3.15 |
| New Zealanders | 0.6 /100 | #273 | Tragic 3.15 |
| Immigrants | Belgium | 0.6 /100 | #274 | Tragic 3.15 |
| Cambodians | 0.6 /100 | #275 | Tragic 3.15 |
| Immigrants | Bosnia and Herzegovina | 0.5 /100 | #276 | Tragic 3.15 |
| Swiss | 0.5 /100 | #277 | Tragic 3.15 |
| Okinawans | 0.5 /100 | #278 | Tragic 3.15 |
| Immigrants | Europe | 0.5 /100 | #279 | Tragic 3.15 |