Immigrants from Belarus vs Swiss Average Family Size
COMPARE
Immigrants from Belarus
Swiss
Average Family Size
Average Family Size Comparison
Immigrants from Belarus
Swiss
3.17
AVERAGE FAMILY SIZE
2.3/ 100
METRIC RATING
248th/ 347
METRIC RANK
3.15
AVERAGE FAMILY SIZE
0.5/ 100
METRIC RATING
277th/ 347
METRIC RANK
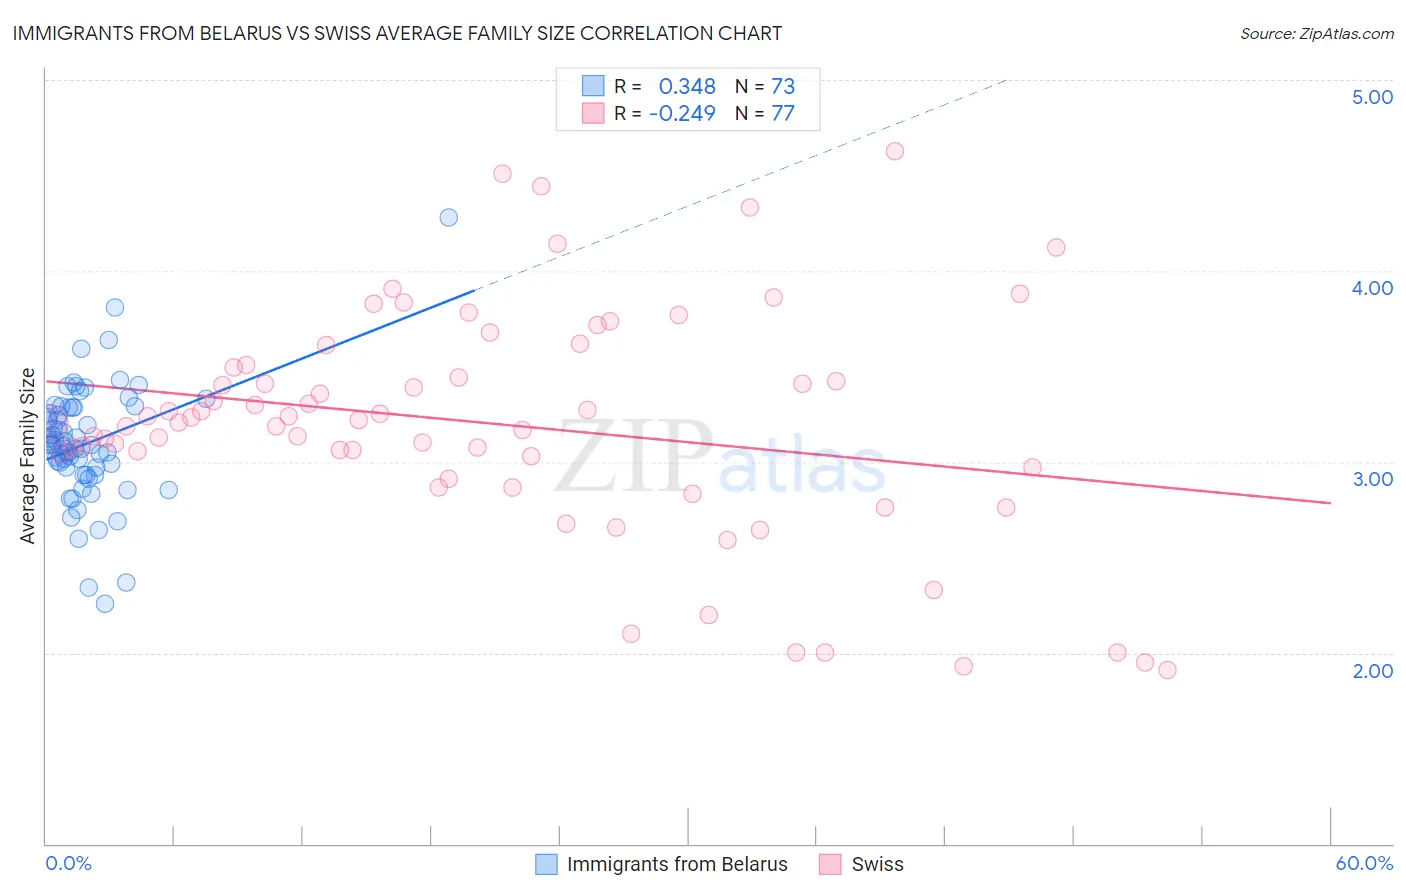
Immigrants from Belarus vs Swiss Average Family Size Correlation Chart
The statistical analysis conducted on geographies consisting of 150,189,025 people shows a mild positive correlation between the proportion of Immigrants from Belarus and average family size in the United States with a correlation coefficient (R) of 0.348 and weighted average of 3.17. Similarly, the statistical analysis conducted on geographies consisting of 464,761,483 people shows a weak negative correlation between the proportion of Swiss and average family size in the United States with a correlation coefficient (R) of -0.249 and weighted average of 3.15, a difference of 0.72%.
Average Family Size Correlation Summary
| Measurement | Immigrants from Belarus | Swiss |
| Minimum | 2.26 | 1.91 |
| Maximum | 4.28 | 4.63 |
| Range | 2.02 | 2.72 |
| Mean | 3.10 | 3.20 |
| Median | 3.09 | 3.21 |
| Interquartile 25% (IQ1) | 2.95 | 2.94 |
| Interquartile 75% (IQ3) | 3.28 | 3.50 |
| Interquartile Range (IQR) | 0.33 | 0.56 |
| Standard Deviation (Sample) | 0.31 | 0.60 |
| Standard Deviation (Population) | 0.31 | 0.60 |
Similar Demographics by Average Family Size
Demographics Similar to Immigrants from Belarus by Average Family Size
In terms of average family size, the demographic groups most similar to Immigrants from Belarus are Cajun (3.17, a difference of 0.030%), Danish (3.17, a difference of 0.040%), Immigrants from Eastern Europe (3.17, a difference of 0.040%), Immigrants from Brazil (3.18, a difference of 0.080%), and Puget Sound Salish (3.17, a difference of 0.10%).
| Demographics | Rating | Rank | Average Family Size |
| Immigrants | Japan | 3.0 /100 | #241 | Tragic 3.18 |
| Hungarians | 3.0 /100 | #242 | Tragic 3.18 |
| Immigrants | Moldova | 2.9 /100 | #243 | Tragic 3.18 |
| Immigrants | Southern Europe | 2.9 /100 | #244 | Tragic 3.18 |
| Immigrants | Brazil | 2.7 /100 | #245 | Tragic 3.18 |
| Danes | 2.5 /100 | #246 | Tragic 3.17 |
| Cajuns | 2.4 /100 | #247 | Tragic 3.17 |
| Immigrants | Belarus | 2.3 /100 | #248 | Tragic 3.17 |
| Immigrants | Eastern Europe | 2.1 /100 | #249 | Tragic 3.17 |
| Puget Sound Salish | 1.9 /100 | #250 | Tragic 3.17 |
| Immigrants | Spain | 1.8 /100 | #251 | Tragic 3.17 |
| Immigrants | Saudi Arabia | 1.7 /100 | #252 | Tragic 3.17 |
| South Africans | 1.7 /100 | #253 | Tragic 3.17 |
| Immigrants | Hungary | 1.7 /100 | #254 | Tragic 3.17 |
| Cape Verdeans | 1.6 /100 | #255 | Tragic 3.17 |
Demographics Similar to Swiss by Average Family Size
In terms of average family size, the demographic groups most similar to Swiss are Immigrants from Bosnia and Herzegovina (3.15, a difference of 0.010%), Okinawan (3.15, a difference of 0.030%), Immigrants from Europe (3.15, a difference of 0.040%), Immigrants from England (3.15, a difference of 0.070%), and New Zealander (3.15, a difference of 0.10%).
| Demographics | Rating | Rank | Average Family Size |
| Tlingit-Haida | 0.7 /100 | #270 | Tragic 3.16 |
| Immigrants | Germany | 0.7 /100 | #271 | Tragic 3.15 |
| Immigrants | Lithuania | 0.6 /100 | #272 | Tragic 3.15 |
| New Zealanders | 0.6 /100 | #273 | Tragic 3.15 |
| Immigrants | Belgium | 0.6 /100 | #274 | Tragic 3.15 |
| Cambodians | 0.6 /100 | #275 | Tragic 3.15 |
| Immigrants | Bosnia and Herzegovina | 0.5 /100 | #276 | Tragic 3.15 |
| Swiss | 0.5 /100 | #277 | Tragic 3.15 |
| Okinawans | 0.5 /100 | #278 | Tragic 3.15 |
| Immigrants | Europe | 0.5 /100 | #279 | Tragic 3.15 |
| Immigrants | England | 0.4 /100 | #280 | Tragic 3.15 |
| Immigrants | Denmark | 0.4 /100 | #281 | Tragic 3.15 |
| Yugoslavians | 0.4 /100 | #282 | Tragic 3.15 |
| German Russians | 0.4 /100 | #283 | Tragic 3.15 |
| Immigrants | France | 0.4 /100 | #284 | Tragic 3.15 |