Portuguese vs Immigrants from Jordan Average Family Size
COMPARE
Portuguese
Immigrants from Jordan
Average Family Size
Average Family Size Comparison
Portuguese
Immigrants from Jordan
3.19
AVERAGE FAMILY SIZE
6.0/ 100
METRIC RATING
227th/ 347
METRIC RANK
3.24
AVERAGE FAMILY SIZE
75.7/ 100
METRIC RATING
147th/ 347
METRIC RANK
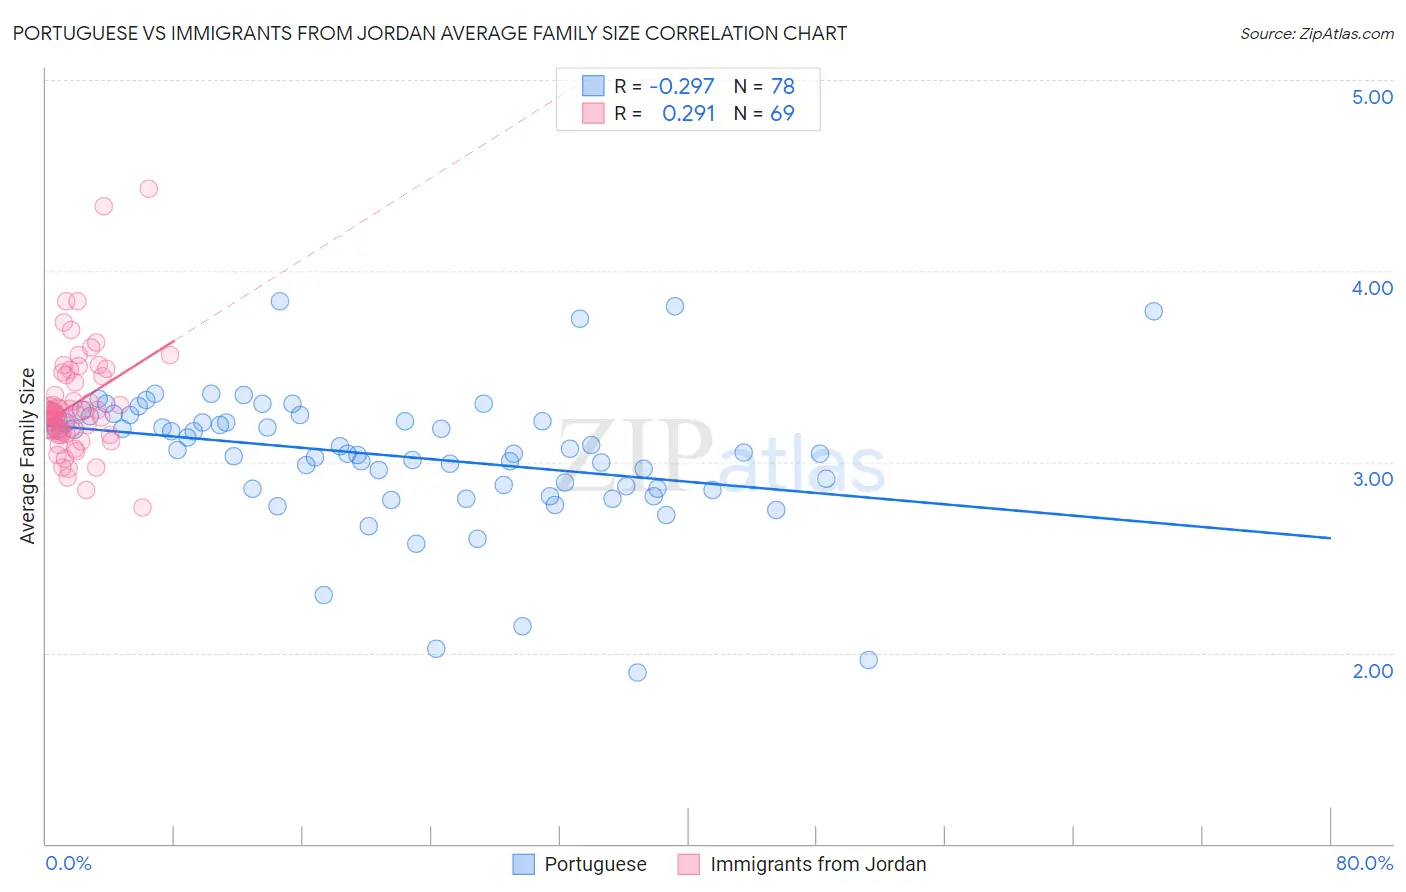
Portuguese vs Immigrants from Jordan Average Family Size Correlation Chart
The statistical analysis conducted on geographies consisting of 449,985,413 people shows a weak negative correlation between the proportion of Portuguese and average family size in the United States with a correlation coefficient (R) of -0.297 and weighted average of 3.19. Similarly, the statistical analysis conducted on geographies consisting of 181,252,628 people shows a weak positive correlation between the proportion of Immigrants from Jordan and average family size in the United States with a correlation coefficient (R) of 0.291 and weighted average of 3.24, a difference of 1.8%.
Average Family Size Correlation Summary
| Measurement | Portuguese | Immigrants from Jordan |
| Minimum | 1.90 | 2.76 |
| Maximum | 3.84 | 4.43 |
| Range | 1.94 | 1.67 |
| Mean | 3.03 | 3.30 |
| Median | 3.06 | 3.25 |
| Interquartile 25% (IQ1) | 2.86 | 3.15 |
| Interquartile 75% (IQ3) | 3.22 | 3.45 |
| Interquartile Range (IQR) | 0.36 | 0.30 |
| Standard Deviation (Sample) | 0.36 | 0.29 |
| Standard Deviation (Population) | 0.36 | 0.28 |
Similar Demographics by Average Family Size
Demographics Similar to Portuguese by Average Family Size
In terms of average family size, the demographic groups most similar to Portuguese are Chickasaw (3.19, a difference of 0.0%), Cree (3.19, a difference of 0.020%), Nonimmigrants (3.19, a difference of 0.020%), Syrian (3.19, a difference of 0.040%), and Immigrants from Italy (3.19, a difference of 0.060%).
| Demographics | Rating | Rank | Average Family Size |
| Lebanese | 9.1 /100 | #220 | Tragic 3.19 |
| Immigrants | Ukraine | 7.2 /100 | #221 | Tragic 3.19 |
| Immigrants | Kuwait | 7.2 /100 | #222 | Tragic 3.19 |
| Immigrants | Zimbabwe | 7.1 /100 | #223 | Tragic 3.19 |
| Syrians | 6.5 /100 | #224 | Tragic 3.19 |
| Cree | 6.2 /100 | #225 | Tragic 3.19 |
| Chickasaw | 6.0 /100 | #226 | Tragic 3.19 |
| Portuguese | 6.0 /100 | #227 | Tragic 3.19 |
| Immigrants | Nonimmigrants | 5.7 /100 | #228 | Tragic 3.19 |
| Immigrants | Italy | 5.3 /100 | #229 | Tragic 3.19 |
| Icelanders | 5.2 /100 | #230 | Tragic 3.19 |
| Basques | 5.2 /100 | #231 | Tragic 3.19 |
| Cherokee | 4.7 /100 | #232 | Tragic 3.18 |
| Brazilians | 4.5 /100 | #233 | Tragic 3.18 |
| Iranians | 4.5 /100 | #234 | Tragic 3.18 |
Demographics Similar to Immigrants from Jordan by Average Family Size
In terms of average family size, the demographic groups most similar to Immigrants from Jordan are Blackfeet (3.24, a difference of 0.020%), Assyrian/Chaldean/Syriac (3.24, a difference of 0.050%), Indian (Asian) (3.24, a difference of 0.050%), Jordanian (3.24, a difference of 0.050%), and Armenian (3.25, a difference of 0.060%).
| Demographics | Rating | Rank | Average Family Size |
| Sub-Saharan Africans | 81.6 /100 | #140 | Excellent 3.25 |
| Venezuelans | 81.4 /100 | #141 | Excellent 3.25 |
| Liberians | 81.2 /100 | #142 | Excellent 3.25 |
| Bhutanese | 81.0 /100 | #143 | Excellent 3.25 |
| Tsimshian | 80.2 /100 | #144 | Excellent 3.25 |
| Armenians | 78.2 /100 | #145 | Good 3.25 |
| Immigrants | Africa | 77.9 /100 | #146 | Good 3.25 |
| Immigrants | Jordan | 75.7 /100 | #147 | Good 3.24 |
| Blackfeet | 75.0 /100 | #148 | Good 3.24 |
| Assyrians/Chaldeans/Syriacs | 73.8 /100 | #149 | Good 3.24 |
| Indians (Asian) | 73.6 /100 | #150 | Good 3.24 |
| Jordanians | 73.5 /100 | #151 | Good 3.24 |
| Spanish Americans | 72.5 /100 | #152 | Good 3.24 |
| Immigrants | Eritrea | 71.4 /100 | #153 | Good 3.24 |
| Immigrants | Egypt | 70.0 /100 | #154 | Good 3.24 |