Immigrants from Senegal vs Immigrants from Jordan Average Family Size
COMPARE
Immigrants from Senegal
Immigrants from Jordan
Average Family Size
Average Family Size Comparison
Immigrants from Senegal
Immigrants from Jordan
3.23
AVERAGE FAMILY SIZE
57.5/ 100
METRIC RATING
166th/ 347
METRIC RANK
3.24
AVERAGE FAMILY SIZE
75.7/ 100
METRIC RATING
147th/ 347
METRIC RANK
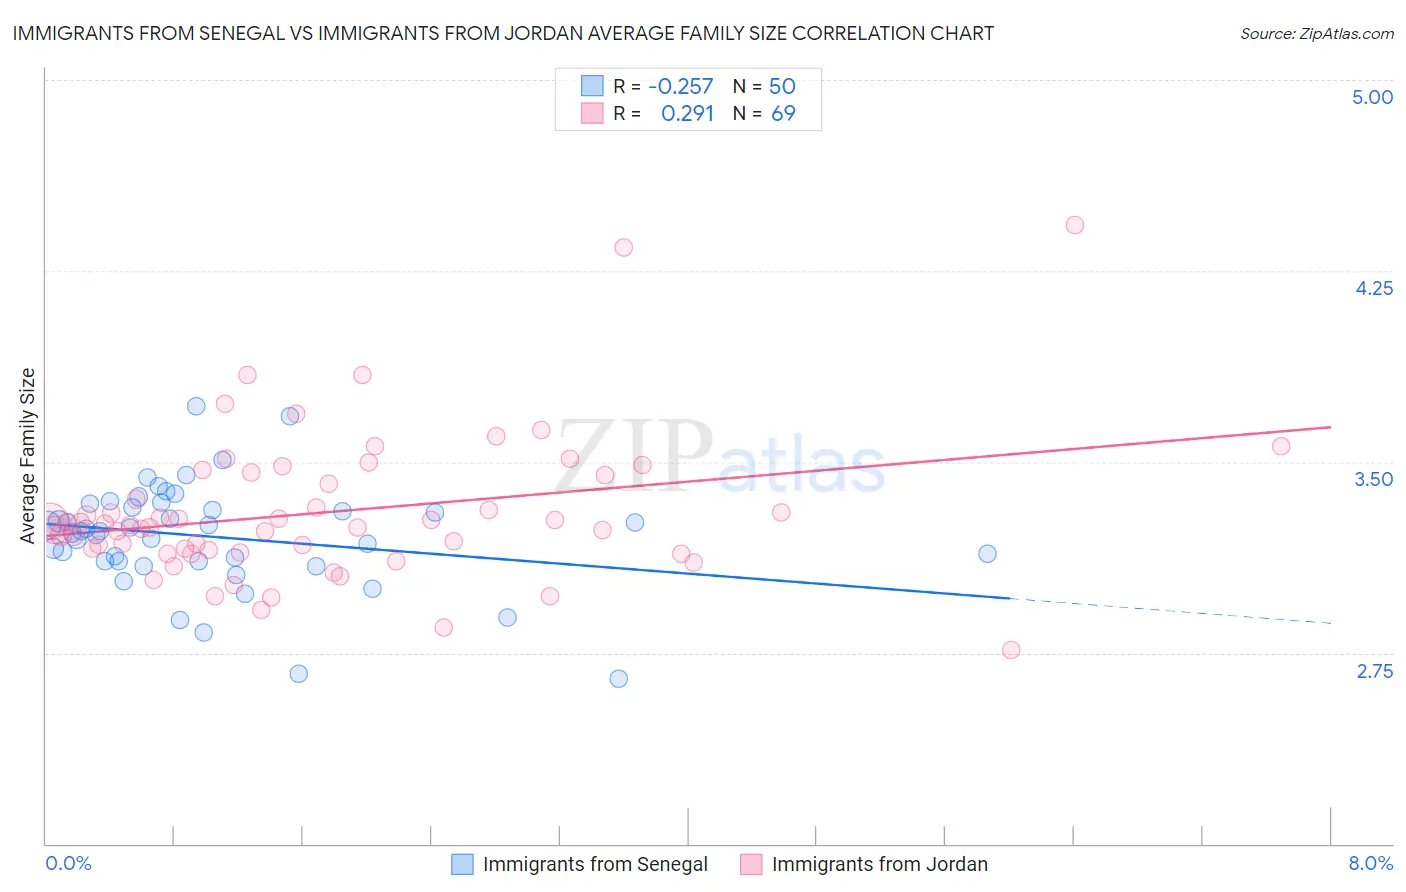
Immigrants from Senegal vs Immigrants from Jordan Average Family Size Correlation Chart
The statistical analysis conducted on geographies consisting of 90,123,819 people shows a weak negative correlation between the proportion of Immigrants from Senegal and average family size in the United States with a correlation coefficient (R) of -0.257 and weighted average of 3.23. Similarly, the statistical analysis conducted on geographies consisting of 181,252,628 people shows a weak positive correlation between the proportion of Immigrants from Jordan and average family size in the United States with a correlation coefficient (R) of 0.291 and weighted average of 3.24, a difference of 0.38%.
Average Family Size Correlation Summary
| Measurement | Immigrants from Senegal | Immigrants from Jordan |
| Minimum | 2.65 | 2.76 |
| Maximum | 3.72 | 4.43 |
| Range | 1.07 | 1.67 |
| Mean | 3.21 | 3.30 |
| Median | 3.23 | 3.25 |
| Interquartile 25% (IQ1) | 3.11 | 3.15 |
| Interquartile 75% (IQ3) | 3.32 | 3.45 |
| Interquartile Range (IQR) | 0.21 | 0.30 |
| Standard Deviation (Sample) | 0.21 | 0.29 |
| Standard Deviation (Population) | 0.21 | 0.28 |
Demographics Similar to Immigrants from Senegal and Immigrants from Jordan by Average Family Size
In terms of average family size, the demographic groups most similar to Immigrants from Senegal are Egyptian (3.23, a difference of 0.020%), Ugandan (3.23, a difference of 0.020%), Uruguayan (3.23, a difference of 0.030%), Immigrants from Uganda (3.23, a difference of 0.050%), and Immigrants from Chile (3.24, a difference of 0.11%). Similarly, the demographic groups most similar to Immigrants from Jordan are Blackfeet (3.24, a difference of 0.020%), Assyrian/Chaldean/Syriac (3.24, a difference of 0.050%), Indian (Asian) (3.24, a difference of 0.050%), Jordanian (3.24, a difference of 0.050%), and Immigrants from Africa (3.25, a difference of 0.060%).
| Demographics | Rating | Rank | Average Family Size |
| Immigrants | Africa | 77.9 /100 | #146 | Good 3.25 |
| Immigrants | Jordan | 75.7 /100 | #147 | Good 3.24 |
| Blackfeet | 75.0 /100 | #148 | Good 3.24 |
| Assyrians/Chaldeans/Syriacs | 73.8 /100 | #149 | Good 3.24 |
| Indians (Asian) | 73.6 /100 | #150 | Good 3.24 |
| Jordanians | 73.5 /100 | #151 | Good 3.24 |
| Spanish Americans | 72.5 /100 | #152 | Good 3.24 |
| Immigrants | Eritrea | 71.4 /100 | #153 | Good 3.24 |
| Immigrants | Egypt | 70.0 /100 | #154 | Good 3.24 |
| Seminole | 68.2 /100 | #155 | Good 3.24 |
| Immigrants | Taiwan | 68.1 /100 | #156 | Good 3.24 |
| Immigrants | Uzbekistan | 67.0 /100 | #157 | Good 3.24 |
| Iraqis | 64.3 /100 | #158 | Good 3.24 |
| Ethiopians | 63.9 /100 | #159 | Good 3.24 |
| Immigrants | Iraq | 63.7 /100 | #160 | Good 3.24 |
| Immigrants | Chile | 63.2 /100 | #161 | Good 3.24 |
| Immigrants | Uganda | 60.1 /100 | #162 | Good 3.23 |
| Uruguayans | 58.8 /100 | #163 | Average 3.23 |
| Egyptians | 58.6 /100 | #164 | Average 3.23 |
| Ugandans | 58.4 /100 | #165 | Average 3.23 |
| Immigrants | Senegal | 57.5 /100 | #166 | Average 3.23 |