Pakistani vs Immigrants from Jordan Unemployment Among Women with Children Under 6 years
COMPARE
Pakistani
Immigrants from Jordan
Unemployment Among Women with Children Under 6 years
Unemployment Among Women with Children Under 6 years Comparison
Pakistanis
Immigrants from Jordan
7.3%
UNEMPLOYMENT AMONG WOMEN WITH CHILDREN UNDER 6 YEARS
92.2/ 100
METRIC RATING
125th/ 347
METRIC RANK
7.5%
UNEMPLOYMENT AMONG WOMEN WITH CHILDREN UNDER 6 YEARS
78.9/ 100
METRIC RATING
145th/ 347
METRIC RANK
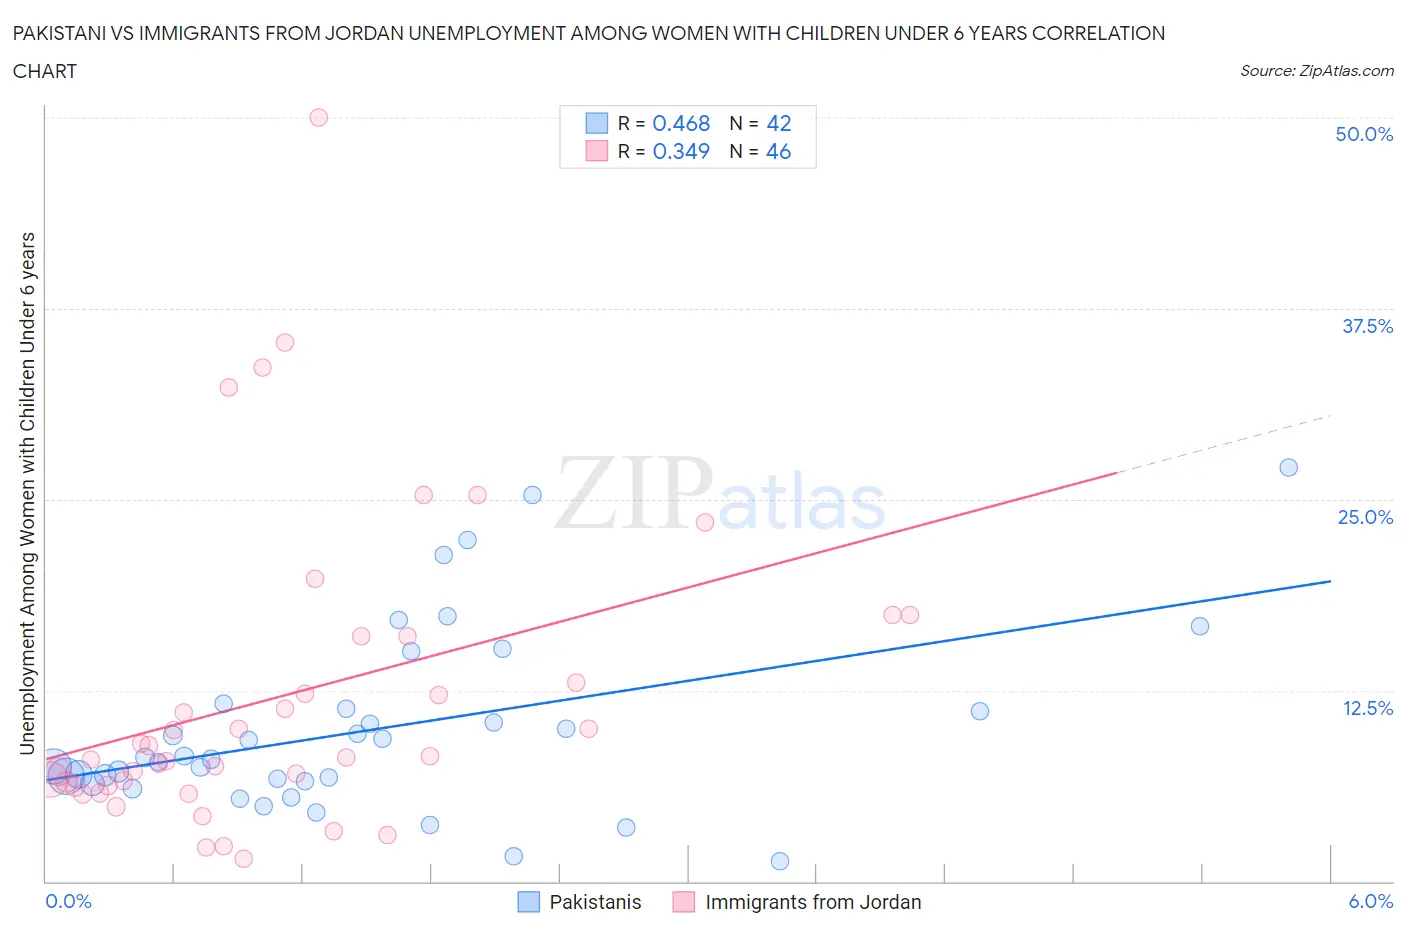
Pakistani vs Immigrants from Jordan Unemployment Among Women with Children Under 6 years Correlation Chart
The statistical analysis conducted on geographies consisting of 266,898,941 people shows a moderate positive correlation between the proportion of Pakistanis and unemployment rate among women with children under the age of 6 in the United States with a correlation coefficient (R) of 0.468 and weighted average of 7.3%. Similarly, the statistical analysis conducted on geographies consisting of 157,070,333 people shows a mild positive correlation between the proportion of Immigrants from Jordan and unemployment rate among women with children under the age of 6 in the United States with a correlation coefficient (R) of 0.349 and weighted average of 7.5%, a difference of 2.0%.
Unemployment Among Women with Children Under 6 years Correlation Summary
| Measurement | Pakistani | Immigrants from Jordan |
| Minimum | 1.3% | 1.5% |
| Maximum | 27.1% | 50.0% |
| Range | 25.8% | 48.5% |
| Mean | 10.0% | 12.2% |
| Median | 8.0% | 8.2% |
| Interquartile 25% (IQ1) | 6.5% | 6.3% |
| Interquartile 75% (IQ3) | 11.3% | 16.0% |
| Interquartile Range (IQR) | 4.8% | 9.7% |
| Standard Deviation (Sample) | 6.0% | 10.1% |
| Standard Deviation (Population) | 5.9% | 9.9% |
Demographics Similar to Pakistanis and Immigrants from Jordan by Unemployment Among Women with Children Under 6 years
In terms of unemployment among women with children under 6 years, the demographic groups most similar to Pakistanis are Immigrants from Burma/Myanmar (7.3%, a difference of 0.070%), Jordanian (7.3%, a difference of 0.16%), Zimbabwean (7.3%, a difference of 0.17%), Slovene (7.4%, a difference of 0.62%), and Swedish (7.4%, a difference of 0.76%). Similarly, the demographic groups most similar to Immigrants from Jordan are European (7.5%, a difference of 0.030%), Korean (7.5%, a difference of 0.26%), Immigrants from Argentina (7.5%, a difference of 0.28%), Greek (7.4%, a difference of 0.40%), and Scandinavian (7.4%, a difference of 0.46%).
| Demographics | Rating | Rank | Unemployment Among Women with Children Under 6 years |
| Pakistanis | 92.2 /100 | #125 | Exceptional 7.3% |
| Immigrants | Burma/Myanmar | 91.9 /100 | #126 | Exceptional 7.3% |
| Jordanians | 91.5 /100 | #127 | Exceptional 7.3% |
| Zimbabweans | 91.5 /100 | #128 | Exceptional 7.3% |
| Slovenes | 89.2 /100 | #129 | Excellent 7.4% |
| Swedes | 88.4 /100 | #130 | Excellent 7.4% |
| Ukrainians | 88.2 /100 | #131 | Excellent 7.4% |
| Immigrants | Armenia | 87.4 /100 | #132 | Excellent 7.4% |
| Immigrants | Uganda | 86.5 /100 | #133 | Excellent 7.4% |
| Immigrants | Bolivia | 85.7 /100 | #134 | Excellent 7.4% |
| Immigrants | Northern Africa | 85.3 /100 | #135 | Excellent 7.4% |
| Immigrants | Morocco | 84.9 /100 | #136 | Excellent 7.4% |
| Immigrants | Cambodia | 84.6 /100 | #137 | Excellent 7.4% |
| Immigrants | Norway | 84.1 /100 | #138 | Excellent 7.4% |
| Immigrants | Colombia | 83.9 /100 | #139 | Excellent 7.4% |
| Scandinavians | 83.0 /100 | #140 | Excellent 7.4% |
| Greeks | 82.6 /100 | #141 | Excellent 7.4% |
| Immigrants | Argentina | 81.5 /100 | #142 | Excellent 7.5% |
| Koreans | 81.3 /100 | #143 | Excellent 7.5% |
| Europeans | 79.1 /100 | #144 | Good 7.5% |
| Immigrants | Jordan | 78.9 /100 | #145 | Good 7.5% |