Turkish vs Immigrants from Iran Average Family Size
COMPARE
Turkish
Immigrants from Iran
Average Family Size
Average Family Size Comparison
Turks
Immigrants from Iran
3.16
AVERAGE FAMILY SIZE
1.3/ 100
METRIC RATING
258th/ 347
METRIC RANK
3.20
AVERAGE FAMILY SIZE
12.1/ 100
METRIC RATING
211th/ 347
METRIC RANK
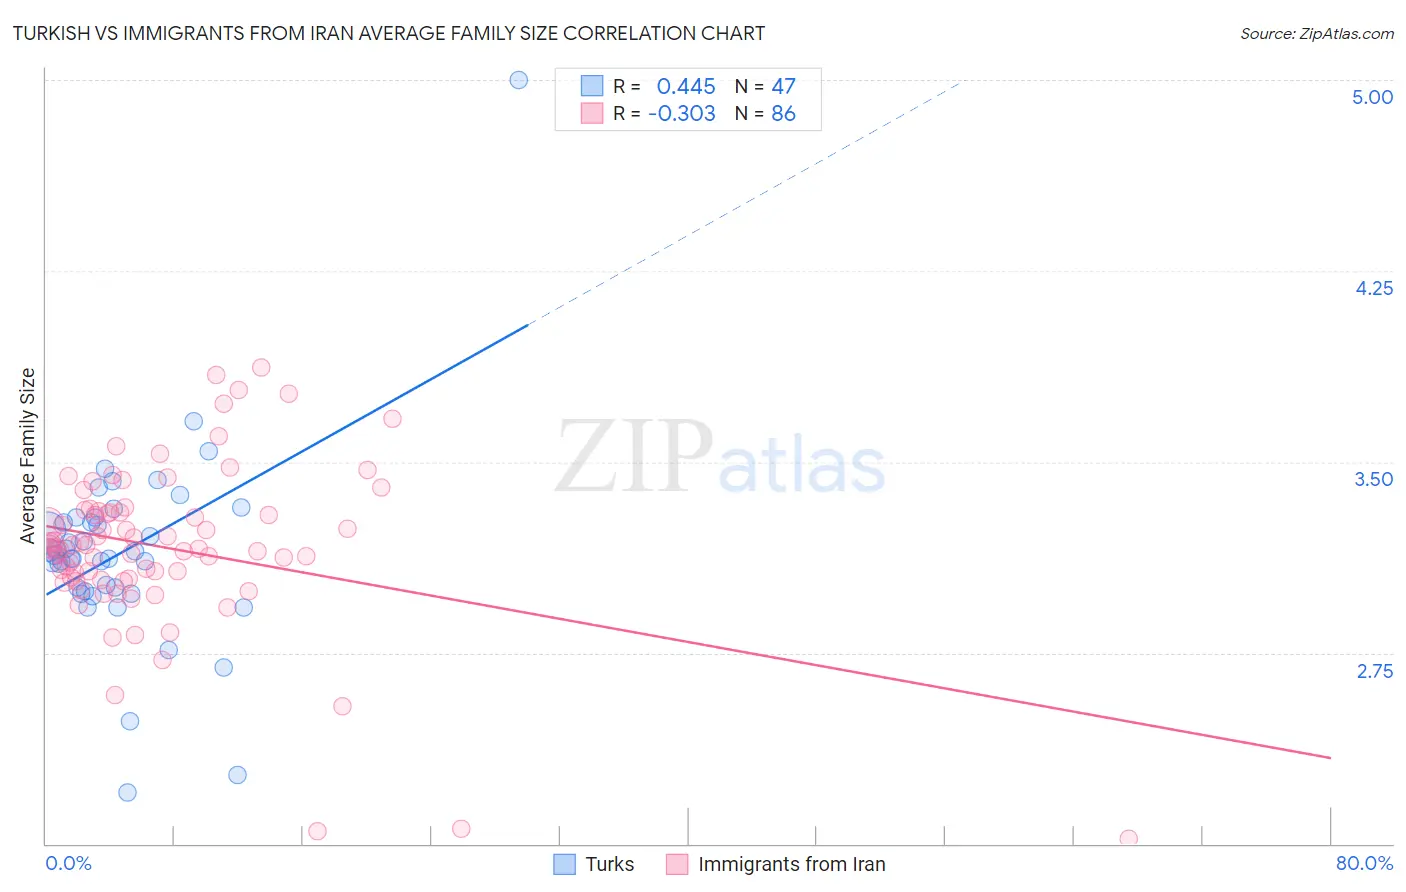
Turkish vs Immigrants from Iran Average Family Size Correlation Chart
The statistical analysis conducted on geographies consisting of 271,710,663 people shows a moderate positive correlation between the proportion of Turks and average family size in the United States with a correlation coefficient (R) of 0.445 and weighted average of 3.16. Similarly, the statistical analysis conducted on geographies consisting of 279,830,460 people shows a mild negative correlation between the proportion of Immigrants from Iran and average family size in the United States with a correlation coefficient (R) of -0.303 and weighted average of 3.20, a difference of 1.1%.
Average Family Size Correlation Summary
| Measurement | Turkish | Immigrants from Iran |
| Minimum | 2.20 | 2.02 |
| Maximum | 5.00 | 3.87 |
| Range | 2.80 | 1.85 |
| Mean | 3.15 | 3.16 |
| Median | 3.13 | 3.16 |
| Interquartile 25% (IQ1) | 2.99 | 3.04 |
| Interquartile 75% (IQ3) | 3.28 | 3.31 |
| Interquartile Range (IQR) | 0.29 | 0.26 |
| Standard Deviation (Sample) | 0.39 | 0.33 |
| Standard Deviation (Population) | 0.39 | 0.33 |
Similar Demographics by Average Family Size
Demographics Similar to Turks by Average Family Size
In terms of average family size, the demographic groups most similar to Turks are Potawatomi (3.16, a difference of 0.0%), Immigrants from Albania (3.16, a difference of 0.010%), Immigrants from North Macedonia (3.16, a difference of 0.010%), Immigrants from Russia (3.16, a difference of 0.020%), and Albanian (3.17, a difference of 0.050%).
| Demographics | Rating | Rank | Average Family Size |
| Immigrants | Spain | 1.8 /100 | #251 | Tragic 3.17 |
| Immigrants | Saudi Arabia | 1.7 /100 | #252 | Tragic 3.17 |
| South Africans | 1.7 /100 | #253 | Tragic 3.17 |
| Immigrants | Hungary | 1.7 /100 | #254 | Tragic 3.17 |
| Cape Verdeans | 1.6 /100 | #255 | Tragic 3.17 |
| Immigrants | Kazakhstan | 1.5 /100 | #256 | Tragic 3.17 |
| Albanians | 1.5 /100 | #257 | Tragic 3.17 |
| Turks | 1.3 /100 | #258 | Tragic 3.16 |
| Potawatomi | 1.3 /100 | #259 | Tragic 3.16 |
| Immigrants | Albania | 1.3 /100 | #260 | Tragic 3.16 |
| Immigrants | North Macedonia | 1.3 /100 | #261 | Tragic 3.16 |
| Immigrants | Russia | 1.3 /100 | #262 | Tragic 3.16 |
| Immigrants | Bulgaria | 1.0 /100 | #263 | Tragic 3.16 |
| Americans | 1.0 /100 | #264 | Tragic 3.16 |
| Immigrants | South Africa | 0.9 /100 | #265 | Tragic 3.16 |
Demographics Similar to Immigrants from Iran by Average Family Size
In terms of average family size, the demographic groups most similar to Immigrants from Iran are Creek (3.20, a difference of 0.0%), Zimbabwean (3.20, a difference of 0.020%), Mongolian (3.20, a difference of 0.020%), Somali (3.20, a difference of 0.040%), and Chippewa (3.20, a difference of 0.050%).
| Demographics | Rating | Rank | Average Family Size |
| Immigrants | Poland | 16.6 /100 | #204 | Poor 3.20 |
| Paraguayans | 16.3 /100 | #205 | Poor 3.20 |
| Immigrants | Cabo Verde | 16.0 /100 | #206 | Poor 3.20 |
| Filipinos | 13.6 /100 | #207 | Poor 3.20 |
| Chippewa | 13.3 /100 | #208 | Poor 3.20 |
| Sudanese | 13.3 /100 | #209 | Poor 3.20 |
| Zimbabweans | 12.6 /100 | #210 | Poor 3.20 |
| Immigrants | Iran | 12.1 /100 | #211 | Poor 3.20 |
| Creek | 12.1 /100 | #212 | Poor 3.20 |
| Mongolians | 11.5 /100 | #213 | Poor 3.20 |
| Somalis | 11.2 /100 | #214 | Poor 3.20 |
| Delaware | 11.1 /100 | #215 | Poor 3.20 |
| Bermudans | 11.0 /100 | #216 | Poor 3.20 |
| Immigrants | Somalia | 10.3 /100 | #217 | Poor 3.20 |
| French American Indians | 9.8 /100 | #218 | Tragic 3.20 |