Immigrants from Sri Lanka vs Immigrants from Iran Average Family Size
COMPARE
Immigrants from Sri Lanka
Immigrants from Iran
Average Family Size
Average Family Size Comparison
Immigrants from Sri Lanka
Immigrants from Iran
3.22
AVERAGE FAMILY SIZE
39.8/ 100
METRIC RATING
185th/ 347
METRIC RANK
3.20
AVERAGE FAMILY SIZE
12.1/ 100
METRIC RATING
211th/ 347
METRIC RANK
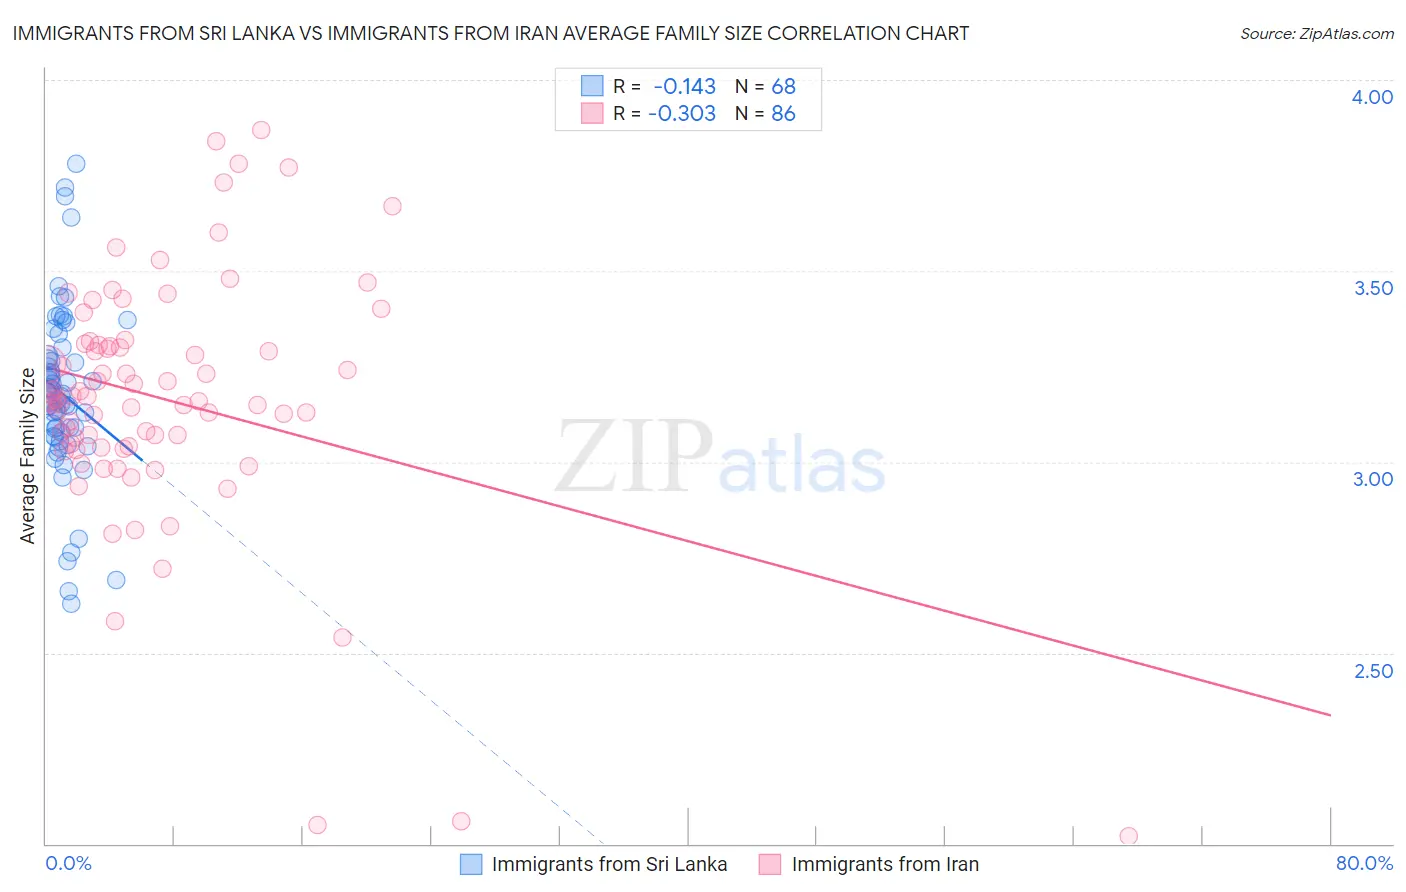
Immigrants from Sri Lanka vs Immigrants from Iran Average Family Size Correlation Chart
The statistical analysis conducted on geographies consisting of 149,689,020 people shows a poor negative correlation between the proportion of Immigrants from Sri Lanka and average family size in the United States with a correlation coefficient (R) of -0.143 and weighted average of 3.22. Similarly, the statistical analysis conducted on geographies consisting of 279,830,460 people shows a mild negative correlation between the proportion of Immigrants from Iran and average family size in the United States with a correlation coefficient (R) of -0.303 and weighted average of 3.20, a difference of 0.72%.
Average Family Size Correlation Summary
| Measurement | Immigrants from Sri Lanka | Immigrants from Iran |
| Minimum | 2.63 | 2.02 |
| Maximum | 3.78 | 3.87 |
| Range | 1.15 | 1.85 |
| Mean | 3.18 | 3.16 |
| Median | 3.17 | 3.16 |
| Interquartile 25% (IQ1) | 3.07 | 3.04 |
| Interquartile 75% (IQ3) | 3.27 | 3.31 |
| Interquartile Range (IQR) | 0.20 | 0.26 |
| Standard Deviation (Sample) | 0.22 | 0.33 |
| Standard Deviation (Population) | 0.22 | 0.33 |
Similar Demographics by Average Family Size
Demographics Similar to Immigrants from Sri Lanka by Average Family Size
In terms of average family size, the demographic groups most similar to Immigrants from Sri Lanka are Immigrants from Argentina (3.22, a difference of 0.0%), Immigrants from Eastern Asia (3.22, a difference of 0.020%), Immigrants from Malaysia (3.22, a difference of 0.020%), Thai (3.22, a difference of 0.030%), and Immigrants from Northern Africa (3.22, a difference of 0.040%).
| Demographics | Rating | Rank | Average Family Size |
| Spaniards | 47.2 /100 | #178 | Average 3.23 |
| Immigrants | Korea | 46.9 /100 | #179 | Average 3.23 |
| Palestinians | 46.6 /100 | #180 | Average 3.23 |
| Spanish | 44.8 /100 | #181 | Average 3.23 |
| Moroccans | 44.2 /100 | #182 | Average 3.22 |
| Immigrants | Northern Africa | 41.7 /100 | #183 | Average 3.22 |
| Immigrants | Eastern Asia | 40.8 /100 | #184 | Average 3.22 |
| Immigrants | Sri Lanka | 39.8 /100 | #185 | Fair 3.22 |
| Immigrants | Argentina | 39.8 /100 | #186 | Fair 3.22 |
| Immigrants | Malaysia | 39.0 /100 | #187 | Fair 3.22 |
| Thais | 38.3 /100 | #188 | Fair 3.22 |
| Pakistanis | 33.7 /100 | #189 | Fair 3.22 |
| Burmese | 31.0 /100 | #190 | Fair 3.22 |
| Immigrants | Zaire | 30.5 /100 | #191 | Fair 3.22 |
| Immigrants | Eastern Africa | 30.1 /100 | #192 | Fair 3.22 |
Demographics Similar to Immigrants from Iran by Average Family Size
In terms of average family size, the demographic groups most similar to Immigrants from Iran are Creek (3.20, a difference of 0.0%), Zimbabwean (3.20, a difference of 0.020%), Mongolian (3.20, a difference of 0.020%), Somali (3.20, a difference of 0.040%), and Chippewa (3.20, a difference of 0.050%).
| Demographics | Rating | Rank | Average Family Size |
| Immigrants | Poland | 16.6 /100 | #204 | Poor 3.20 |
| Paraguayans | 16.3 /100 | #205 | Poor 3.20 |
| Immigrants | Cabo Verde | 16.0 /100 | #206 | Poor 3.20 |
| Filipinos | 13.6 /100 | #207 | Poor 3.20 |
| Chippewa | 13.3 /100 | #208 | Poor 3.20 |
| Sudanese | 13.3 /100 | #209 | Poor 3.20 |
| Zimbabweans | 12.6 /100 | #210 | Poor 3.20 |
| Immigrants | Iran | 12.1 /100 | #211 | Poor 3.20 |
| Creek | 12.1 /100 | #212 | Poor 3.20 |
| Mongolians | 11.5 /100 | #213 | Poor 3.20 |
| Somalis | 11.2 /100 | #214 | Poor 3.20 |
| Delaware | 11.1 /100 | #215 | Poor 3.20 |
| Bermudans | 11.0 /100 | #216 | Poor 3.20 |
| Immigrants | Somalia | 10.3 /100 | #217 | Poor 3.20 |
| French American Indians | 9.8 /100 | #218 | Tragic 3.20 |