Immigrants from Sierra Leone vs Immigrants from Iran Average Family Size
COMPARE
Immigrants from Sierra Leone
Immigrants from Iran
Average Family Size
Average Family Size Comparison
Immigrants from Sierra Leone
Immigrants from Iran
3.32
AVERAGE FAMILY SIZE
99.9/ 100
METRIC RATING
74th/ 347
METRIC RANK
3.20
AVERAGE FAMILY SIZE
12.1/ 100
METRIC RATING
211th/ 347
METRIC RANK
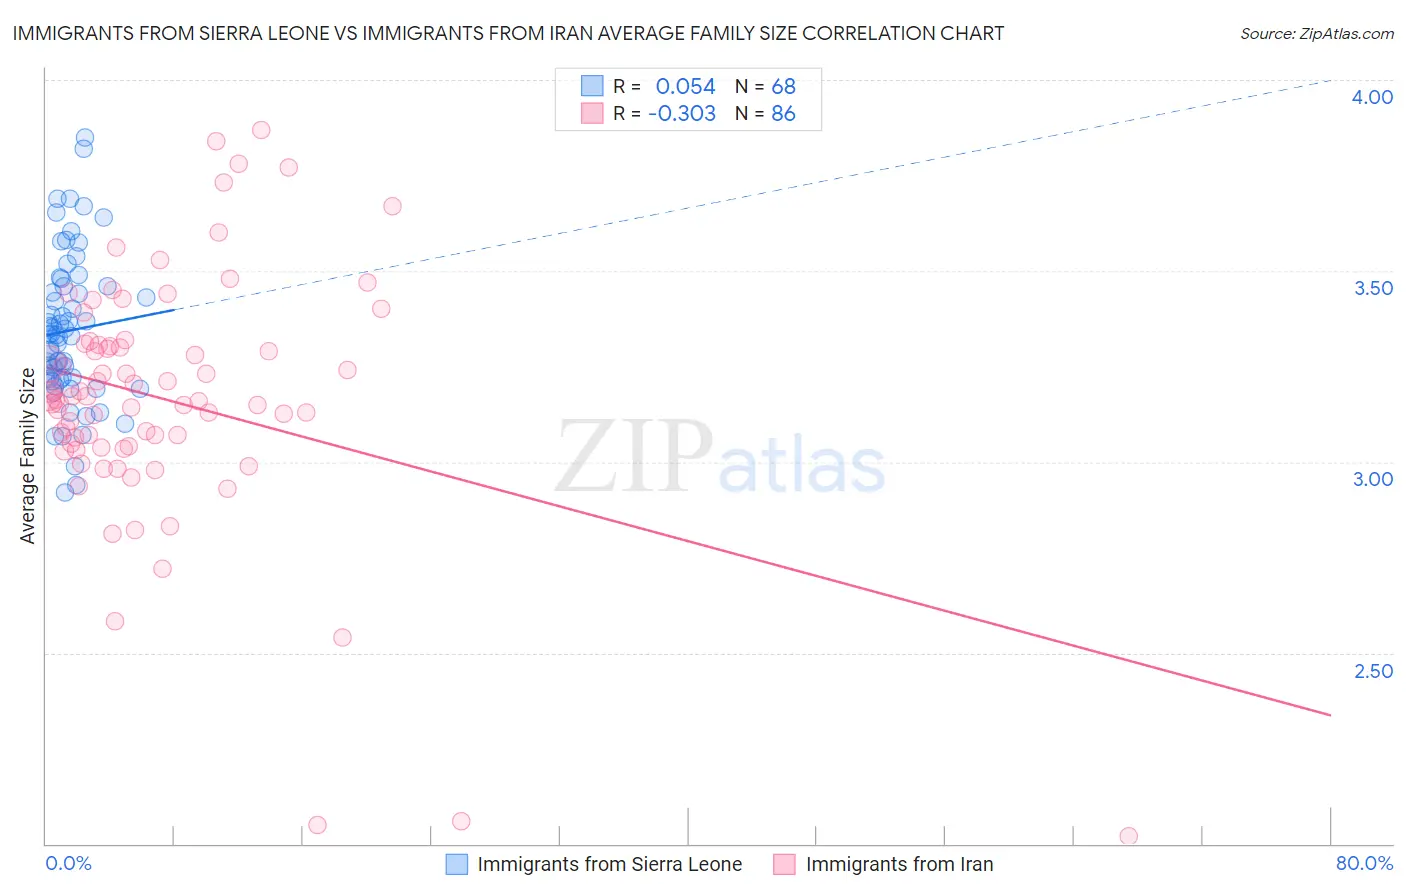
Immigrants from Sierra Leone vs Immigrants from Iran Average Family Size Correlation Chart
The statistical analysis conducted on geographies consisting of 101,646,973 people shows a slight positive correlation between the proportion of Immigrants from Sierra Leone and average family size in the United States with a correlation coefficient (R) of 0.054 and weighted average of 3.32. Similarly, the statistical analysis conducted on geographies consisting of 279,830,460 people shows a mild negative correlation between the proportion of Immigrants from Iran and average family size in the United States with a correlation coefficient (R) of -0.303 and weighted average of 3.20, a difference of 3.9%.
Average Family Size Correlation Summary
| Measurement | Immigrants from Sierra Leone | Immigrants from Iran |
| Minimum | 2.92 | 2.02 |
| Maximum | 3.85 | 3.87 |
| Range | 0.93 | 1.85 |
| Mean | 3.34 | 3.16 |
| Median | 3.33 | 3.16 |
| Interquartile 25% (IQ1) | 3.21 | 3.04 |
| Interquartile 75% (IQ3) | 3.46 | 3.31 |
| Interquartile Range (IQR) | 0.25 | 0.26 |
| Standard Deviation (Sample) | 0.20 | 0.33 |
| Standard Deviation (Population) | 0.20 | 0.33 |
Similar Demographics by Average Family Size
Demographics Similar to Immigrants from Sierra Leone by Average Family Size
In terms of average family size, the demographic groups most similar to Immigrants from Sierra Leone are Yaqui (3.32, a difference of 0.030%), Immigrants from Barbados (3.32, a difference of 0.030%), Immigrants from Caribbean (3.33, a difference of 0.050%), Trinidadian and Tobagonian (3.32, a difference of 0.050%), and Immigrants from Ecuador (3.32, a difference of 0.060%).
| Demographics | Rating | Rank | Average Family Size |
| Immigrants | Jamaica | 99.9 /100 | #67 | Exceptional 3.33 |
| Immigrants | Cambodia | 99.9 /100 | #68 | Exceptional 3.33 |
| Immigrants | Immigrants | 99.9 /100 | #69 | Exceptional 3.33 |
| Immigrants | Trinidad and Tobago | 99.9 /100 | #70 | Exceptional 3.33 |
| Immigrants | West Indies | 99.9 /100 | #71 | Exceptional 3.33 |
| Immigrants | Caribbean | 99.9 /100 | #72 | Exceptional 3.33 |
| Yaqui | 99.9 /100 | #73 | Exceptional 3.32 |
| Immigrants | Sierra Leone | 99.9 /100 | #74 | Exceptional 3.32 |
| Immigrants | Barbados | 99.8 /100 | #75 | Exceptional 3.32 |
| Trinidadians and Tobagonians | 99.8 /100 | #76 | Exceptional 3.32 |
| Immigrants | Ecuador | 99.8 /100 | #77 | Exceptional 3.32 |
| Immigrants | Micronesia | 99.8 /100 | #78 | Exceptional 3.32 |
| British West Indians | 99.8 /100 | #79 | Exceptional 3.32 |
| Lumbee | 99.8 /100 | #80 | Exceptional 3.32 |
| Immigrants | Dominica | 99.8 /100 | #81 | Exceptional 3.32 |
Demographics Similar to Immigrants from Iran by Average Family Size
In terms of average family size, the demographic groups most similar to Immigrants from Iran are Creek (3.20, a difference of 0.0%), Zimbabwean (3.20, a difference of 0.020%), Mongolian (3.20, a difference of 0.020%), Somali (3.20, a difference of 0.040%), and Chippewa (3.20, a difference of 0.050%).
| Demographics | Rating | Rank | Average Family Size |
| Immigrants | Poland | 16.6 /100 | #204 | Poor 3.20 |
| Paraguayans | 16.3 /100 | #205 | Poor 3.20 |
| Immigrants | Cabo Verde | 16.0 /100 | #206 | Poor 3.20 |
| Filipinos | 13.6 /100 | #207 | Poor 3.20 |
| Chippewa | 13.3 /100 | #208 | Poor 3.20 |
| Sudanese | 13.3 /100 | #209 | Poor 3.20 |
| Zimbabweans | 12.6 /100 | #210 | Poor 3.20 |
| Immigrants | Iran | 12.1 /100 | #211 | Poor 3.20 |
| Creek | 12.1 /100 | #212 | Poor 3.20 |
| Mongolians | 11.5 /100 | #213 | Poor 3.20 |
| Somalis | 11.2 /100 | #214 | Poor 3.20 |
| Delaware | 11.1 /100 | #215 | Poor 3.20 |
| Bermudans | 11.0 /100 | #216 | Poor 3.20 |
| Immigrants | Somalia | 10.3 /100 | #217 | Poor 3.20 |
| French American Indians | 9.8 /100 | #218 | Tragic 3.20 |