Immigrants from Uzbekistan vs Dutch West Indian Average Family Size
COMPARE
Immigrants from Uzbekistan
Dutch West Indian
Average Family Size
Average Family Size Comparison
Immigrants from Uzbekistan
Dutch West Indians
3.24
AVERAGE FAMILY SIZE
67.0/ 100
METRIC RATING
157th/ 347
METRIC RANK
3.23
AVERAGE FAMILY SIZE
56.9/ 100
METRIC RATING
167th/ 347
METRIC RANK
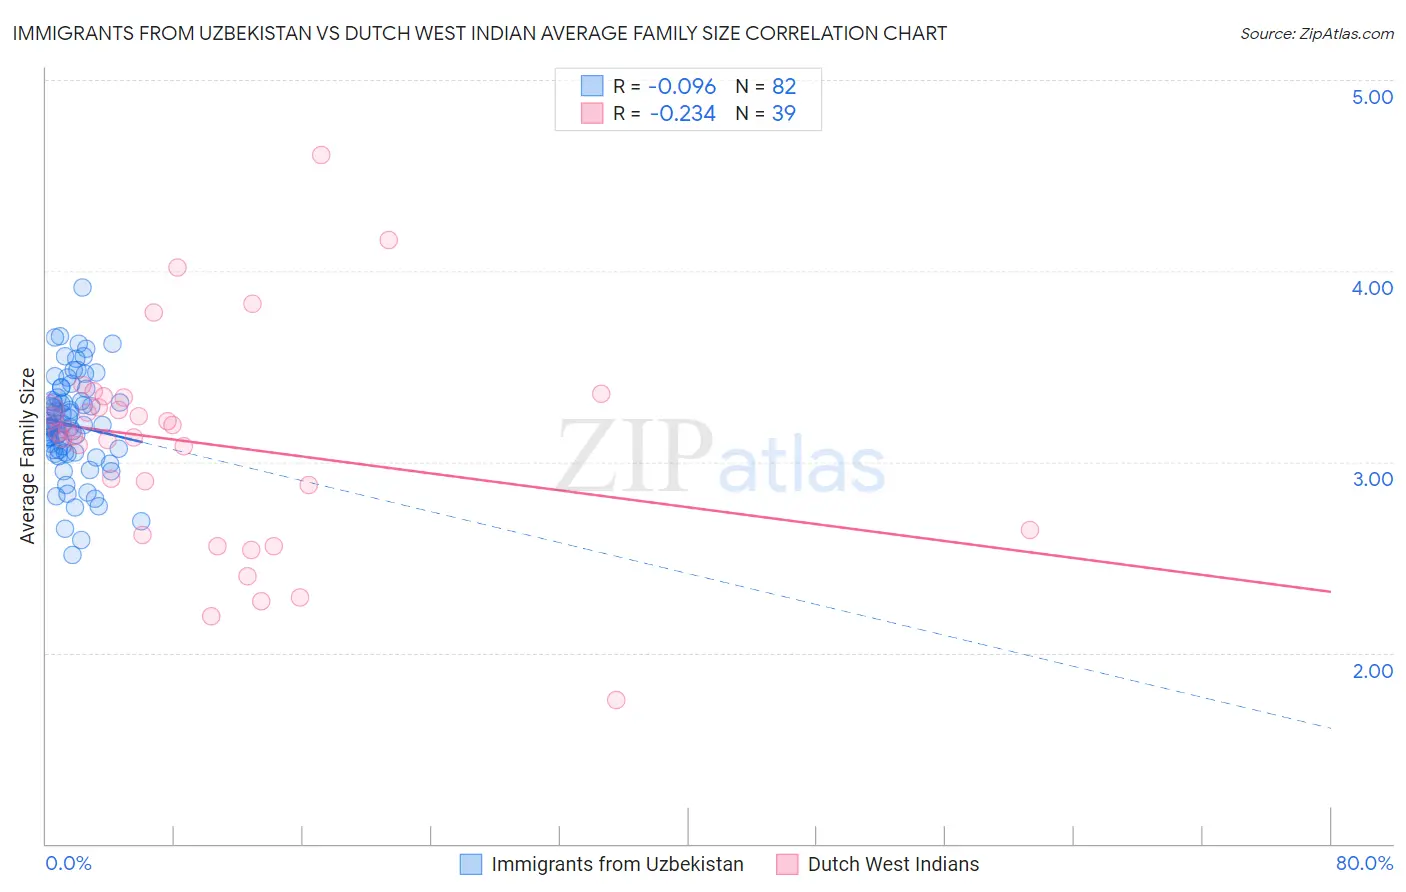
Immigrants from Uzbekistan vs Dutch West Indian Average Family Size Correlation Chart
The statistical analysis conducted on geographies consisting of 118,722,943 people shows a slight negative correlation between the proportion of Immigrants from Uzbekistan and average family size in the United States with a correlation coefficient (R) of -0.096 and weighted average of 3.24. Similarly, the statistical analysis conducted on geographies consisting of 85,766,577 people shows a weak negative correlation between the proportion of Dutch West Indians and average family size in the United States with a correlation coefficient (R) of -0.234 and weighted average of 3.23, a difference of 0.20%.
Average Family Size Correlation Summary
| Measurement | Immigrants from Uzbekistan | Dutch West Indian |
| Minimum | 2.51 | 1.75 |
| Maximum | 3.91 | 4.61 |
| Range | 1.40 | 2.86 |
| Mean | 3.19 | 3.09 |
| Median | 3.19 | 3.15 |
| Interquartile 25% (IQ1) | 3.05 | 2.64 |
| Interquartile 75% (IQ3) | 3.32 | 3.33 |
| Interquartile Range (IQR) | 0.27 | 0.69 |
| Standard Deviation (Sample) | 0.26 | 0.56 |
| Standard Deviation (Population) | 0.26 | 0.55 |
Demographics Similar to Immigrants from Uzbekistan and Dutch West Indians by Average Family Size
In terms of average family size, the demographic groups most similar to Immigrants from Uzbekistan are Seminole (3.24, a difference of 0.020%), Immigrants from Taiwan (3.24, a difference of 0.020%), Iraqi (3.24, a difference of 0.050%), Immigrants from Egypt (3.24, a difference of 0.060%), and Ethiopian (3.24, a difference of 0.060%). Similarly, the demographic groups most similar to Dutch West Indians are Immigrants from Senegal (3.23, a difference of 0.010%), Egyptian (3.23, a difference of 0.030%), Ugandan (3.23, a difference of 0.030%), Uruguayan (3.23, a difference of 0.040%), and Taiwanese (3.23, a difference of 0.050%).
| Demographics | Rating | Rank | Average Family Size |
| Spanish Americans | 72.5 /100 | #152 | Good 3.24 |
| Immigrants | Eritrea | 71.4 /100 | #153 | Good 3.24 |
| Immigrants | Egypt | 70.0 /100 | #154 | Good 3.24 |
| Seminole | 68.2 /100 | #155 | Good 3.24 |
| Immigrants | Taiwan | 68.1 /100 | #156 | Good 3.24 |
| Immigrants | Uzbekistan | 67.0 /100 | #157 | Good 3.24 |
| Iraqis | 64.3 /100 | #158 | Good 3.24 |
| Ethiopians | 63.9 /100 | #159 | Good 3.24 |
| Immigrants | Iraq | 63.7 /100 | #160 | Good 3.24 |
| Immigrants | Chile | 63.2 /100 | #161 | Good 3.24 |
| Immigrants | Uganda | 60.1 /100 | #162 | Good 3.23 |
| Uruguayans | 58.8 /100 | #163 | Average 3.23 |
| Egyptians | 58.6 /100 | #164 | Average 3.23 |
| Ugandans | 58.4 /100 | #165 | Average 3.23 |
| Immigrants | Senegal | 57.5 /100 | #166 | Average 3.23 |
| Dutch West Indians | 56.9 /100 | #167 | Average 3.23 |
| Taiwanese | 54.2 /100 | #168 | Average 3.23 |
| Aleuts | 54.1 /100 | #169 | Average 3.23 |
| Arabs | 53.8 /100 | #170 | Average 3.23 |
| Chileans | 53.2 /100 | #171 | Average 3.23 |
| Immigrants | Congo | 52.7 /100 | #172 | Average 3.23 |