Immigrants from Africa vs Dutch West Indian Average Family Size
COMPARE
Immigrants from Africa
Dutch West Indian
Average Family Size
Average Family Size Comparison
Immigrants from Africa
Dutch West Indians
3.25
AVERAGE FAMILY SIZE
77.9/ 100
METRIC RATING
146th/ 347
METRIC RANK
3.23
AVERAGE FAMILY SIZE
56.9/ 100
METRIC RATING
167th/ 347
METRIC RANK
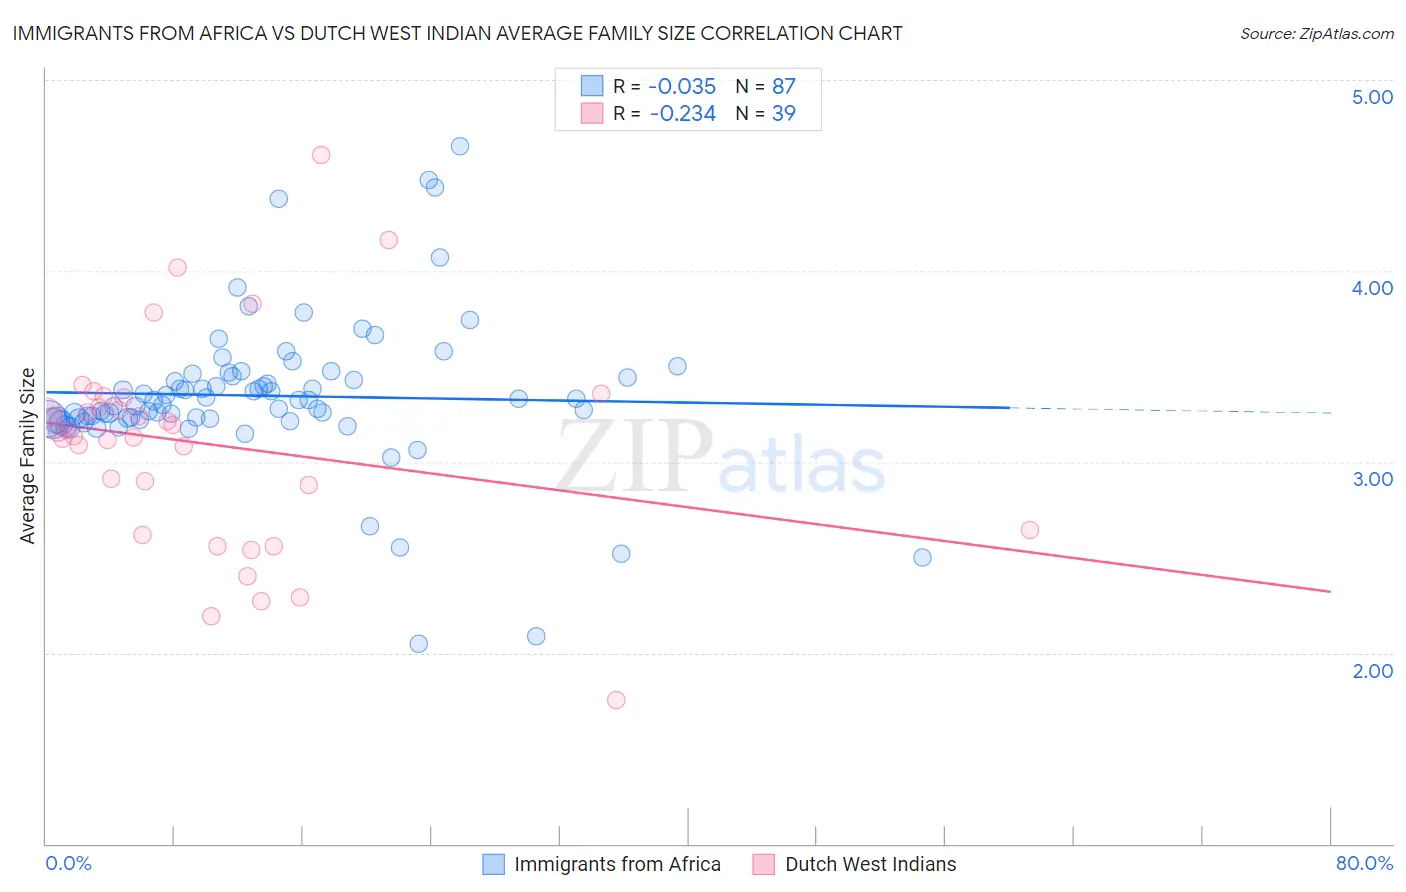
Immigrants from Africa vs Dutch West Indian Average Family Size Correlation Chart
The statistical analysis conducted on geographies consisting of 468,951,664 people shows no correlation between the proportion of Immigrants from Africa and average family size in the United States with a correlation coefficient (R) of -0.035 and weighted average of 3.25. Similarly, the statistical analysis conducted on geographies consisting of 85,766,577 people shows a weak negative correlation between the proportion of Dutch West Indians and average family size in the United States with a correlation coefficient (R) of -0.234 and weighted average of 3.23, a difference of 0.45%.
Average Family Size Correlation Summary
| Measurement | Immigrants from Africa | Dutch West Indian |
| Minimum | 2.05 | 1.75 |
| Maximum | 4.66 | 4.61 |
| Range | 2.61 | 2.86 |
| Mean | 3.35 | 3.09 |
| Median | 3.32 | 3.15 |
| Interquartile 25% (IQ1) | 3.23 | 2.64 |
| Interquartile 75% (IQ3) | 3.45 | 3.33 |
| Interquartile Range (IQR) | 0.23 | 0.69 |
| Standard Deviation (Sample) | 0.40 | 0.56 |
| Standard Deviation (Population) | 0.40 | 0.55 |
Similar Demographics by Average Family Size
Demographics Similar to Immigrants from Africa by Average Family Size
In terms of average family size, the demographic groups most similar to Immigrants from Africa are Armenian (3.25, a difference of 0.010%), Tsimshian (3.25, a difference of 0.060%), Immigrants from Jordan (3.24, a difference of 0.060%), Blackfeet (3.24, a difference of 0.070%), and Liberian (3.25, a difference of 0.090%).
| Demographics | Rating | Rank | Average Family Size |
| Immigrants | Ethiopia | 81.6 /100 | #139 | Excellent 3.25 |
| Sub-Saharan Africans | 81.6 /100 | #140 | Excellent 3.25 |
| Venezuelans | 81.4 /100 | #141 | Excellent 3.25 |
| Liberians | 81.2 /100 | #142 | Excellent 3.25 |
| Bhutanese | 81.0 /100 | #143 | Excellent 3.25 |
| Tsimshian | 80.2 /100 | #144 | Excellent 3.25 |
| Armenians | 78.2 /100 | #145 | Good 3.25 |
| Immigrants | Africa | 77.9 /100 | #146 | Good 3.25 |
| Immigrants | Jordan | 75.7 /100 | #147 | Good 3.24 |
| Blackfeet | 75.0 /100 | #148 | Good 3.24 |
| Assyrians/Chaldeans/Syriacs | 73.8 /100 | #149 | Good 3.24 |
| Indians (Asian) | 73.6 /100 | #150 | Good 3.24 |
| Jordanians | 73.5 /100 | #151 | Good 3.24 |
| Spanish Americans | 72.5 /100 | #152 | Good 3.24 |
| Immigrants | Eritrea | 71.4 /100 | #153 | Good 3.24 |
Demographics Similar to Dutch West Indians by Average Family Size
In terms of average family size, the demographic groups most similar to Dutch West Indians are Immigrants from Senegal (3.23, a difference of 0.010%), Egyptian (3.23, a difference of 0.030%), Ugandan (3.23, a difference of 0.030%), Uruguayan (3.23, a difference of 0.040%), and Taiwanese (3.23, a difference of 0.050%).
| Demographics | Rating | Rank | Average Family Size |
| Immigrants | Iraq | 63.7 /100 | #160 | Good 3.24 |
| Immigrants | Chile | 63.2 /100 | #161 | Good 3.24 |
| Immigrants | Uganda | 60.1 /100 | #162 | Good 3.23 |
| Uruguayans | 58.8 /100 | #163 | Average 3.23 |
| Egyptians | 58.6 /100 | #164 | Average 3.23 |
| Ugandans | 58.4 /100 | #165 | Average 3.23 |
| Immigrants | Senegal | 57.5 /100 | #166 | Average 3.23 |
| Dutch West Indians | 56.9 /100 | #167 | Average 3.23 |
| Taiwanese | 54.2 /100 | #168 | Average 3.23 |
| Aleuts | 54.1 /100 | #169 | Average 3.23 |
| Arabs | 53.8 /100 | #170 | Average 3.23 |
| Chileans | 53.2 /100 | #171 | Average 3.23 |
| Immigrants | Congo | 52.7 /100 | #172 | Average 3.23 |
| Immigrants | Uruguay | 52.0 /100 | #173 | Average 3.23 |
| Immigrants | South Central Asia | 50.0 /100 | #174 | Average 3.23 |