Nepalese vs Immigrants from Panama Family Households
COMPARE
Nepalese
Immigrants from Panama
Family Households
Family Households Comparison
Nepalese
Immigrants from Panama
67.2%
FAMILY HOUSEHOLDS
100.0/ 100
METRIC RATING
32nd/ 347
METRIC RANK
64.8%
FAMILY HOUSEHOLDS
92.0/ 100
METRIC RATING
127th/ 347
METRIC RANK
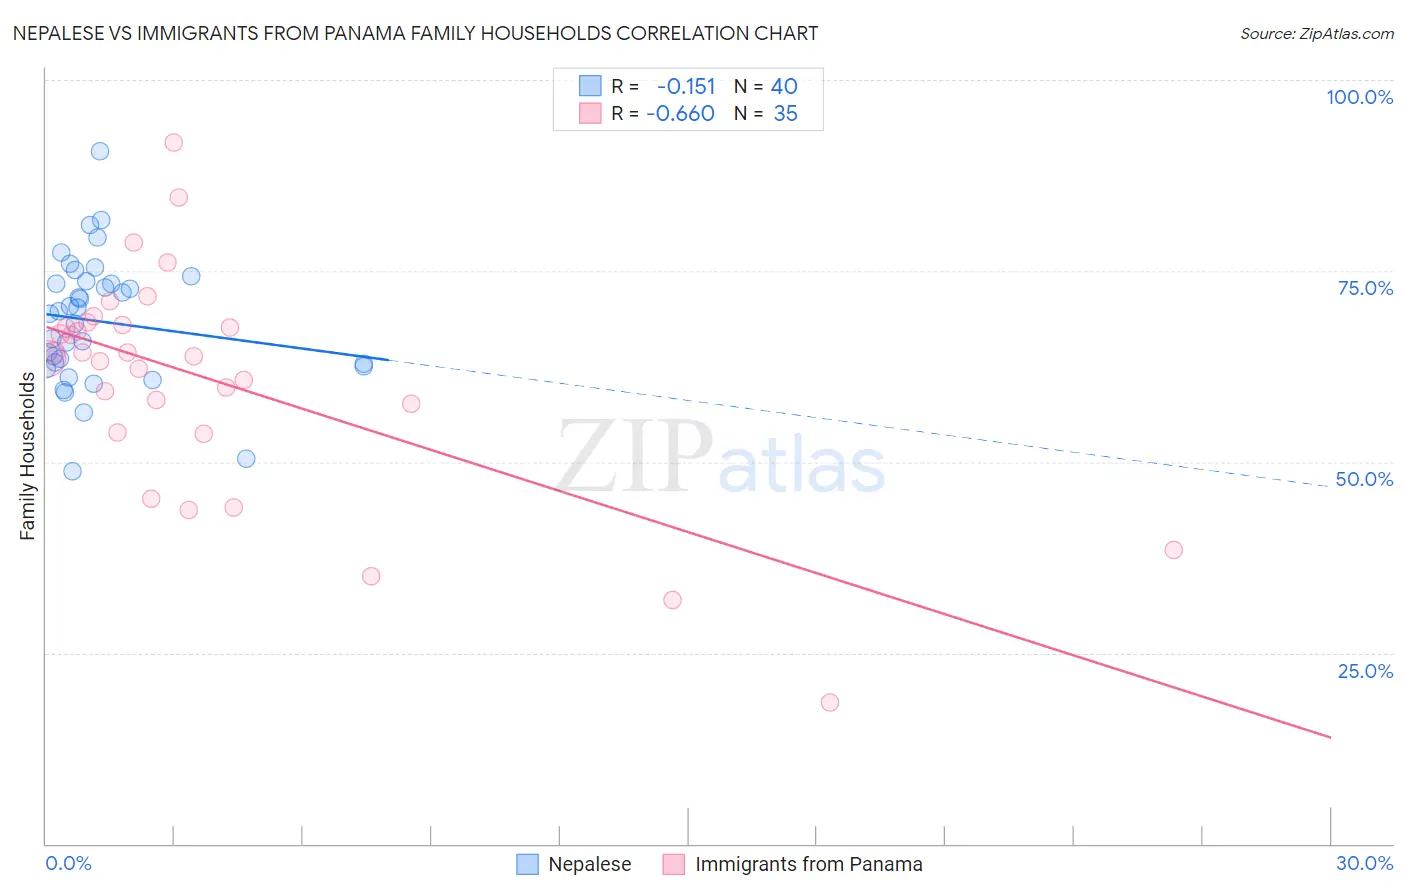
Nepalese vs Immigrants from Panama Family Households Correlation Chart
The statistical analysis conducted on geographies consisting of 24,521,755 people shows a poor negative correlation between the proportion of Nepalese and percentage of family households in the United States with a correlation coefficient (R) of -0.151 and weighted average of 67.2%. Similarly, the statistical analysis conducted on geographies consisting of 221,156,465 people shows a significant negative correlation between the proportion of Immigrants from Panama and percentage of family households in the United States with a correlation coefficient (R) of -0.660 and weighted average of 64.8%, a difference of 3.6%.
Family Households Correlation Summary
| Measurement | Nepalese | Immigrants from Panama |
| Minimum | 48.7% | 18.6% |
| Maximum | 90.6% | 91.8% |
| Range | 41.9% | 73.2% |
| Mean | 68.4% | 60.6% |
| Median | 69.5% | 63.8% |
| Interquartile 25% (IQ1) | 62.7% | 53.8% |
| Interquartile 75% (IQ3) | 73.5% | 68.0% |
| Interquartile Range (IQR) | 10.9% | 14.2% |
| Standard Deviation (Sample) | 8.5% | 14.8% |
| Standard Deviation (Population) | 8.4% | 14.6% |
Similar Demographics by Family Households
Demographics Similar to Nepalese by Family Households
In terms of family households, the demographic groups most similar to Nepalese are Salvadoran (67.2%, a difference of 0.040%), Thai (67.2%, a difference of 0.040%), Immigrants from Latin America (67.2%, a difference of 0.060%), Immigrants from Peru (67.2%, a difference of 0.070%), and Tohono O'odham (67.1%, a difference of 0.090%).
| Demographics | Rating | Rank | Family Households |
| Immigrants | Nicaragua | 100.0 /100 | #25 | Exceptional 67.5% |
| Immigrants | India | 100.0 /100 | #26 | Exceptional 67.4% |
| Hispanics or Latinos | 100.0 /100 | #27 | Exceptional 67.4% |
| Hawaiians | 100.0 /100 | #28 | Exceptional 67.4% |
| Nicaraguans | 100.0 /100 | #29 | Exceptional 67.4% |
| Immigrants | Peru | 100.0 /100 | #30 | Exceptional 67.2% |
| Immigrants | Latin America | 100.0 /100 | #31 | Exceptional 67.2% |
| Nepalese | 100.0 /100 | #32 | Exceptional 67.2% |
| Salvadorans | 100.0 /100 | #33 | Exceptional 67.2% |
| Thais | 100.0 /100 | #34 | Exceptional 67.2% |
| Tohono O'odham | 100.0 /100 | #35 | Exceptional 67.1% |
| Peruvians | 100.0 /100 | #36 | Exceptional 67.1% |
| Tsimshian | 100.0 /100 | #37 | Exceptional 67.1% |
| Mexican American Indians | 100.0 /100 | #38 | Exceptional 67.0% |
| Immigrants | El Salvador | 100.0 /100 | #39 | Exceptional 67.0% |
Demographics Similar to Immigrants from Panama by Family Households
In terms of family households, the demographic groups most similar to Immigrants from Panama are Italian (64.8%, a difference of 0.010%), Panamanian (64.8%, a difference of 0.020%), Immigrants from Belize (64.9%, a difference of 0.030%), Immigrants from Ecuador (64.8%, a difference of 0.030%), and Immigrants from Argentina (64.9%, a difference of 0.040%).
| Demographics | Rating | Rank | Family Households |
| Immigrants | Oceania | 94.2 /100 | #120 | Exceptional 64.9% |
| Hungarians | 94.0 /100 | #121 | Exceptional 64.9% |
| Hmong | 93.4 /100 | #122 | Exceptional 64.9% |
| Choctaw | 93.4 /100 | #123 | Exceptional 64.9% |
| Immigrants | Argentina | 92.8 /100 | #124 | Exceptional 64.9% |
| Immigrants | Belize | 92.7 /100 | #125 | Exceptional 64.9% |
| Panamanians | 92.4 /100 | #126 | Exceptional 64.8% |
| Immigrants | Panama | 92.0 /100 | #127 | Exceptional 64.8% |
| Italians | 91.9 /100 | #128 | Exceptional 64.8% |
| Immigrants | Ecuador | 91.4 /100 | #129 | Exceptional 64.8% |
| Immigrants | Italy | 90.2 /100 | #130 | Exceptional 64.8% |
| Immigrants | Nonimmigrants | 90.1 /100 | #131 | Exceptional 64.8% |
| Cajuns | 89.4 /100 | #132 | Excellent 64.8% |
| Belizeans | 89.3 /100 | #133 | Excellent 64.8% |
| Greeks | 88.1 /100 | #134 | Excellent 64.7% |