Menominee vs South American Indian Average Family Size
COMPARE
Menominee
South American Indian
Average Family Size
Average Family Size Comparison
Menominee
South American Indians
3.30
AVERAGE FAMILY SIZE
99.4/ 100
METRIC RATING
90th/ 347
METRIC RANK
3.26
AVERAGE FAMILY SIZE
91.6/ 100
METRIC RATING
124th/ 347
METRIC RANK
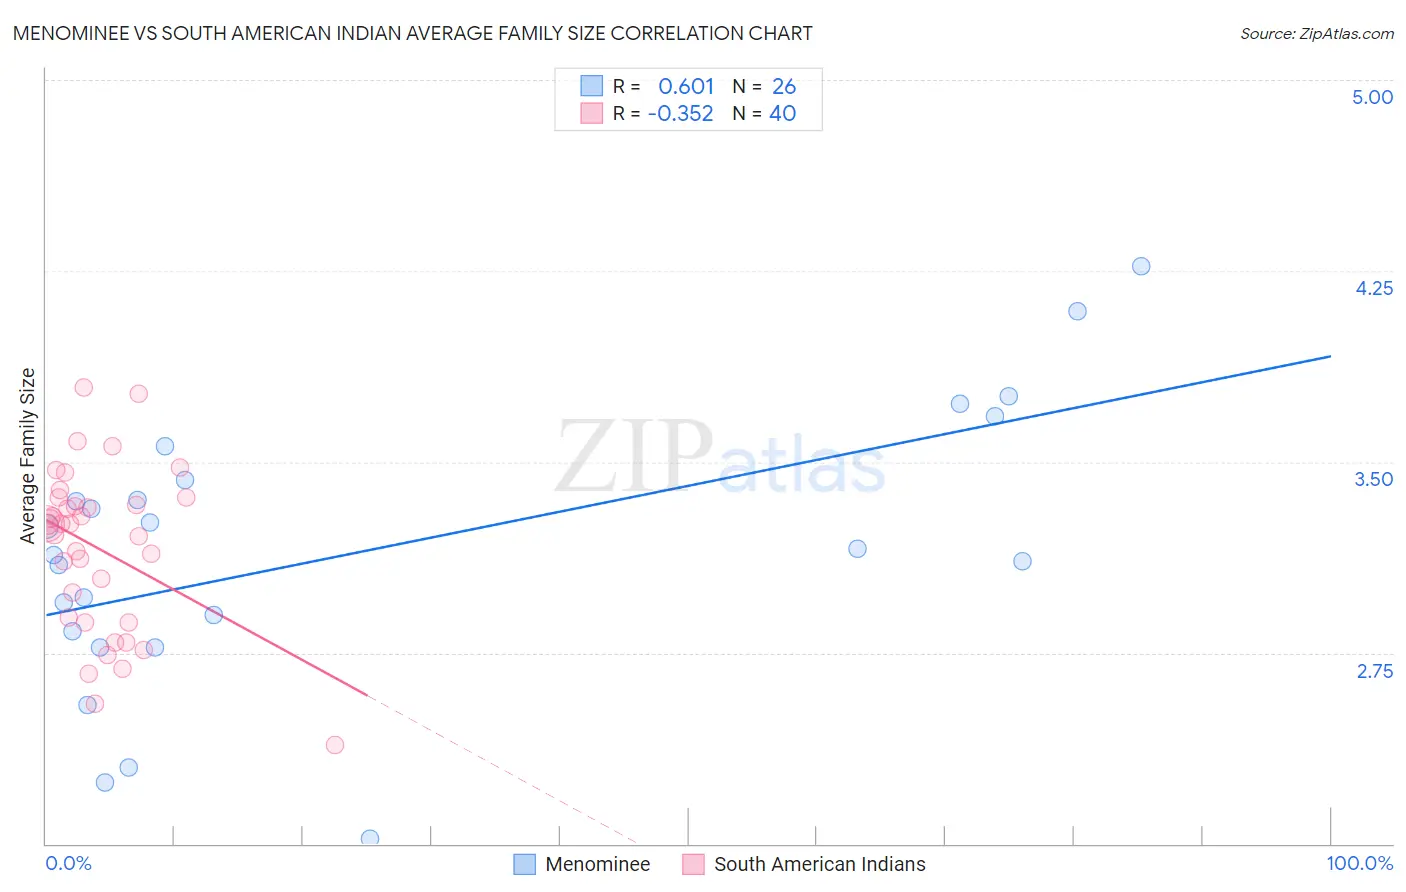
Menominee vs South American Indian Average Family Size Correlation Chart
The statistical analysis conducted on geographies consisting of 45,777,849 people shows a significant positive correlation between the proportion of Menominee and average family size in the United States with a correlation coefficient (R) of 0.601 and weighted average of 3.30. Similarly, the statistical analysis conducted on geographies consisting of 164,540,094 people shows a mild negative correlation between the proportion of South American Indians and average family size in the United States with a correlation coefficient (R) of -0.352 and weighted average of 3.26, a difference of 1.3%.
Average Family Size Correlation Summary
| Measurement | Menominee | South American Indian |
| Minimum | 2.02 | 2.39 |
| Maximum | 4.27 | 3.79 |
| Range | 2.25 | 1.40 |
| Mean | 3.15 | 3.16 |
| Median | 3.15 | 3.26 |
| Interquartile 25% (IQ1) | 2.83 | 2.88 |
| Interquartile 75% (IQ3) | 3.43 | 3.35 |
| Interquartile Range (IQR) | 0.60 | 0.47 |
| Standard Deviation (Sample) | 0.54 | 0.32 |
| Standard Deviation (Population) | 0.53 | 0.32 |
Similar Demographics by Average Family Size
Demographics Similar to Menominee by Average Family Size
In terms of average family size, the demographic groups most similar to Menominee are Malaysian (3.31, a difference of 0.11%), Immigrants from Bolivia (3.31, a difference of 0.12%), Immigrants from Pakistan (3.30, a difference of 0.15%), Immigrants from Cameroon (3.30, a difference of 0.16%), and Peruvian (3.30, a difference of 0.17%).
| Demographics | Rating | Rank | Average Family Size |
| Immigrants | Afghanistan | 99.8 /100 | #83 | Exceptional 3.32 |
| Immigrants | Nigeria | 99.7 /100 | #84 | Exceptional 3.32 |
| Afghans | 99.7 /100 | #85 | Exceptional 3.31 |
| Jamaicans | 99.7 /100 | #86 | Exceptional 3.31 |
| Immigrants | Peru | 99.7 /100 | #87 | Exceptional 3.31 |
| Immigrants | Bolivia | 99.6 /100 | #88 | Exceptional 3.31 |
| Malaysians | 99.6 /100 | #89 | Exceptional 3.31 |
| Menominee | 99.4 /100 | #90 | Exceptional 3.30 |
| Immigrants | Pakistan | 99.2 /100 | #91 | Exceptional 3.30 |
| Immigrants | Cameroon | 99.2 /100 | #92 | Exceptional 3.30 |
| Peruvians | 99.2 /100 | #93 | Exceptional 3.30 |
| Sierra Leoneans | 99.0 /100 | #94 | Exceptional 3.30 |
| Immigrants | Lebanon | 99.0 /100 | #95 | Exceptional 3.30 |
| U.S. Virgin Islanders | 98.8 /100 | #96 | Exceptional 3.29 |
| Immigrants | Oceania | 98.7 /100 | #97 | Exceptional 3.29 |
Demographics Similar to South American Indians by Average Family Size
In terms of average family size, the demographic groups most similar to South American Indians are Immigrants from Cuba (3.26, a difference of 0.020%), Alaskan Athabascan (3.27, a difference of 0.050%), Immigrants from Costa Rica (3.26, a difference of 0.050%), Immigrants from Syria (3.26, a difference of 0.060%), and Immigrants from Colombia (3.27, a difference of 0.070%).
| Demographics | Rating | Rank | Average Family Size |
| Kiowa | 94.8 /100 | #117 | Exceptional 3.27 |
| Immigrants | Asia | 94.0 /100 | #118 | Exceptional 3.27 |
| Immigrants | Indonesia | 93.7 /100 | #119 | Exceptional 3.27 |
| Immigrants | Bahamas | 93.6 /100 | #120 | Exceptional 3.27 |
| Immigrants | Thailand | 93.3 /100 | #121 | Exceptional 3.27 |
| Immigrants | Colombia | 92.8 /100 | #122 | Exceptional 3.27 |
| Alaskan Athabascans | 92.4 /100 | #123 | Exceptional 3.27 |
| South American Indians | 91.6 /100 | #124 | Exceptional 3.26 |
| Immigrants | Cuba | 91.3 /100 | #125 | Exceptional 3.26 |
| Immigrants | Costa Rica | 90.7 /100 | #126 | Exceptional 3.26 |
| Immigrants | Syria | 90.6 /100 | #127 | Exceptional 3.26 |
| Colombians | 89.9 /100 | #128 | Excellent 3.26 |
| Immigrants | Hong Kong | 88.6 /100 | #129 | Excellent 3.26 |
| Laotians | 88.5 /100 | #130 | Excellent 3.26 |
| Immigrants | Western Asia | 87.7 /100 | #131 | Excellent 3.26 |