Menominee vs Immigrants from Belarus Average Family Size
COMPARE
Menominee
Immigrants from Belarus
Average Family Size
Average Family Size Comparison
Menominee
Immigrants from Belarus
3.30
AVERAGE FAMILY SIZE
99.4/ 100
METRIC RATING
90th/ 347
METRIC RANK
3.17
AVERAGE FAMILY SIZE
2.3/ 100
METRIC RATING
248th/ 347
METRIC RANK
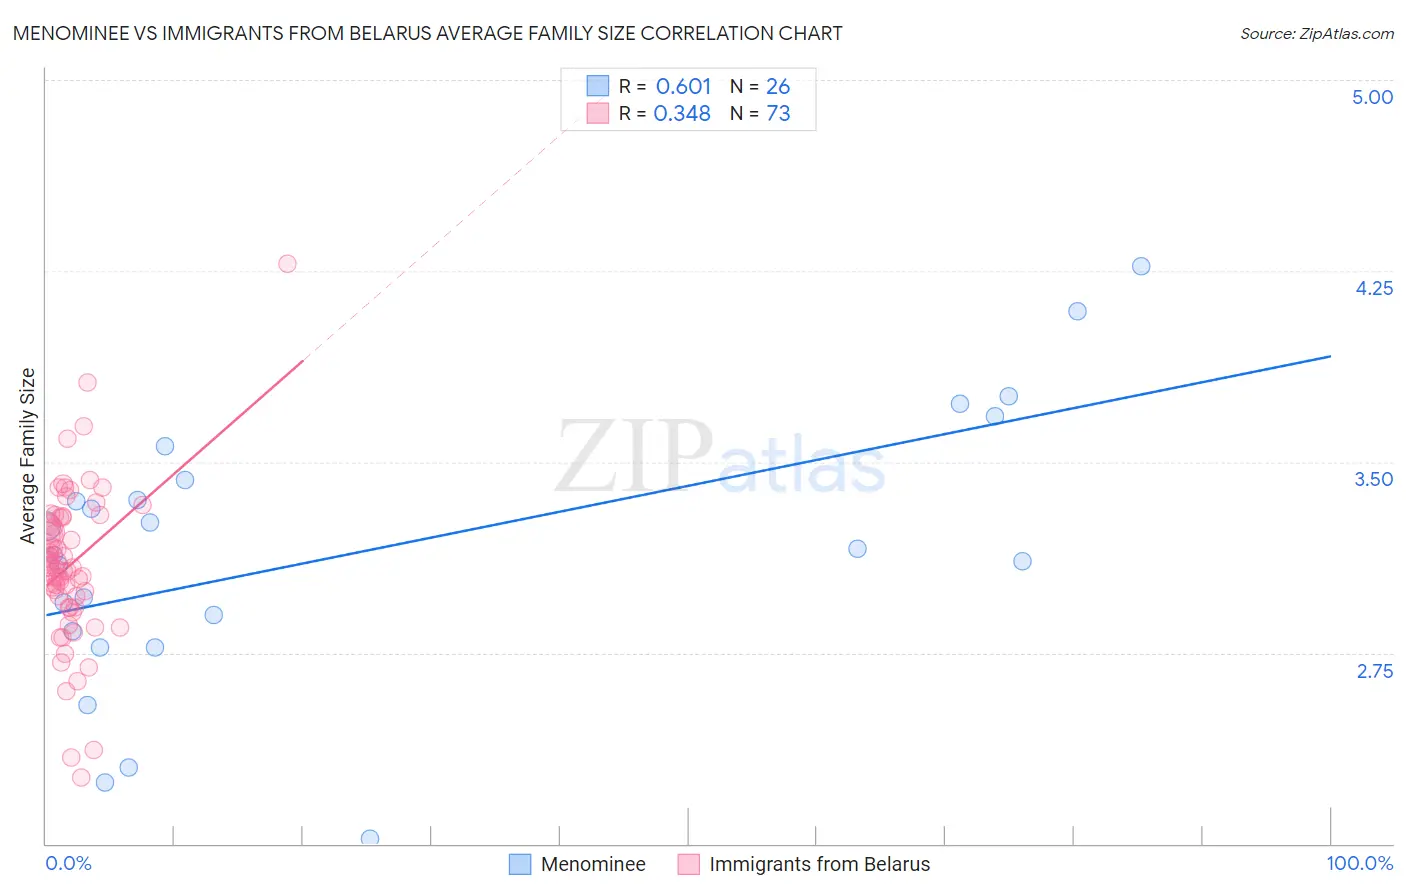
Menominee vs Immigrants from Belarus Average Family Size Correlation Chart
The statistical analysis conducted on geographies consisting of 45,777,849 people shows a significant positive correlation between the proportion of Menominee and average family size in the United States with a correlation coefficient (R) of 0.601 and weighted average of 3.30. Similarly, the statistical analysis conducted on geographies consisting of 150,189,025 people shows a mild positive correlation between the proportion of Immigrants from Belarus and average family size in the United States with a correlation coefficient (R) of 0.348 and weighted average of 3.17, a difference of 4.1%.
Average Family Size Correlation Summary
| Measurement | Menominee | Immigrants from Belarus |
| Minimum | 2.02 | 2.26 |
| Maximum | 4.27 | 4.28 |
| Range | 2.25 | 2.02 |
| Mean | 3.15 | 3.10 |
| Median | 3.15 | 3.09 |
| Interquartile 25% (IQ1) | 2.83 | 2.95 |
| Interquartile 75% (IQ3) | 3.43 | 3.28 |
| Interquartile Range (IQR) | 0.60 | 0.33 |
| Standard Deviation (Sample) | 0.54 | 0.31 |
| Standard Deviation (Population) | 0.53 | 0.31 |
Similar Demographics by Average Family Size
Demographics Similar to Menominee by Average Family Size
In terms of average family size, the demographic groups most similar to Menominee are Malaysian (3.31, a difference of 0.11%), Immigrants from Bolivia (3.31, a difference of 0.12%), Immigrants from Pakistan (3.30, a difference of 0.15%), Immigrants from Cameroon (3.30, a difference of 0.16%), and Peruvian (3.30, a difference of 0.17%).
| Demographics | Rating | Rank | Average Family Size |
| Immigrants | Afghanistan | 99.8 /100 | #83 | Exceptional 3.32 |
| Immigrants | Nigeria | 99.7 /100 | #84 | Exceptional 3.32 |
| Afghans | 99.7 /100 | #85 | Exceptional 3.31 |
| Jamaicans | 99.7 /100 | #86 | Exceptional 3.31 |
| Immigrants | Peru | 99.7 /100 | #87 | Exceptional 3.31 |
| Immigrants | Bolivia | 99.6 /100 | #88 | Exceptional 3.31 |
| Malaysians | 99.6 /100 | #89 | Exceptional 3.31 |
| Menominee | 99.4 /100 | #90 | Exceptional 3.30 |
| Immigrants | Pakistan | 99.2 /100 | #91 | Exceptional 3.30 |
| Immigrants | Cameroon | 99.2 /100 | #92 | Exceptional 3.30 |
| Peruvians | 99.2 /100 | #93 | Exceptional 3.30 |
| Sierra Leoneans | 99.0 /100 | #94 | Exceptional 3.30 |
| Immigrants | Lebanon | 99.0 /100 | #95 | Exceptional 3.30 |
| U.S. Virgin Islanders | 98.8 /100 | #96 | Exceptional 3.29 |
| Immigrants | Oceania | 98.7 /100 | #97 | Exceptional 3.29 |
Demographics Similar to Immigrants from Belarus by Average Family Size
In terms of average family size, the demographic groups most similar to Immigrants from Belarus are Cajun (3.17, a difference of 0.030%), Danish (3.17, a difference of 0.040%), Immigrants from Eastern Europe (3.17, a difference of 0.040%), Immigrants from Brazil (3.18, a difference of 0.080%), and Puget Sound Salish (3.17, a difference of 0.10%).
| Demographics | Rating | Rank | Average Family Size |
| Immigrants | Japan | 3.0 /100 | #241 | Tragic 3.18 |
| Hungarians | 3.0 /100 | #242 | Tragic 3.18 |
| Immigrants | Moldova | 2.9 /100 | #243 | Tragic 3.18 |
| Immigrants | Southern Europe | 2.9 /100 | #244 | Tragic 3.18 |
| Immigrants | Brazil | 2.7 /100 | #245 | Tragic 3.18 |
| Danes | 2.5 /100 | #246 | Tragic 3.17 |
| Cajuns | 2.4 /100 | #247 | Tragic 3.17 |
| Immigrants | Belarus | 2.3 /100 | #248 | Tragic 3.17 |
| Immigrants | Eastern Europe | 2.1 /100 | #249 | Tragic 3.17 |
| Puget Sound Salish | 1.9 /100 | #250 | Tragic 3.17 |
| Immigrants | Spain | 1.8 /100 | #251 | Tragic 3.17 |
| Immigrants | Saudi Arabia | 1.7 /100 | #252 | Tragic 3.17 |
| South Africans | 1.7 /100 | #253 | Tragic 3.17 |
| Immigrants | Hungary | 1.7 /100 | #254 | Tragic 3.17 |
| Cape Verdeans | 1.6 /100 | #255 | Tragic 3.17 |