Menominee vs Immigrants from Canada Average Family Size
COMPARE
Menominee
Immigrants from Canada
Average Family Size
Average Family Size Comparison
Menominee
Immigrants from Canada
3.30
AVERAGE FAMILY SIZE
99.4/ 100
METRIC RATING
90th/ 347
METRIC RANK
3.12
AVERAGE FAMILY SIZE
0.0/ 100
METRIC RATING
322nd/ 347
METRIC RANK
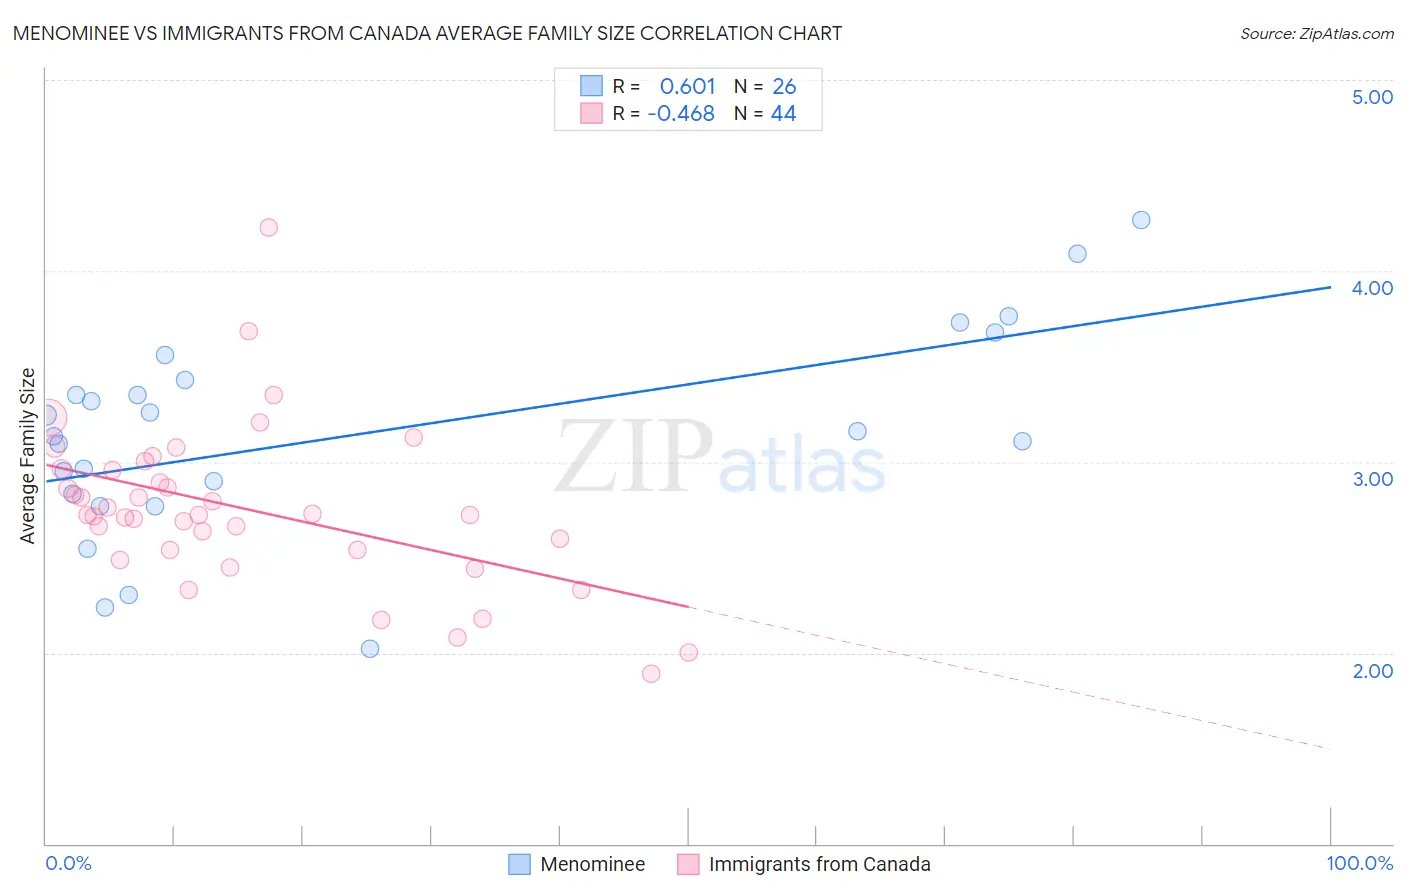
Menominee vs Immigrants from Canada Average Family Size Correlation Chart
The statistical analysis conducted on geographies consisting of 45,777,849 people shows a significant positive correlation between the proportion of Menominee and average family size in the United States with a correlation coefficient (R) of 0.601 and weighted average of 3.30. Similarly, the statistical analysis conducted on geographies consisting of 459,128,299 people shows a moderate negative correlation between the proportion of Immigrants from Canada and average family size in the United States with a correlation coefficient (R) of -0.468 and weighted average of 3.12, a difference of 6.1%.
Average Family Size Correlation Summary
| Measurement | Menominee | Immigrants from Canada |
| Minimum | 2.02 | 1.89 |
| Maximum | 4.27 | 4.23 |
| Range | 2.25 | 2.34 |
| Mean | 3.15 | 2.76 |
| Median | 3.15 | 2.72 |
| Interquartile 25% (IQ1) | 2.83 | 2.54 |
| Interquartile 75% (IQ3) | 3.43 | 2.96 |
| Interquartile Range (IQR) | 0.60 | 0.42 |
| Standard Deviation (Sample) | 0.54 | 0.42 |
| Standard Deviation (Population) | 0.53 | 0.42 |
Similar Demographics by Average Family Size
Demographics Similar to Menominee by Average Family Size
In terms of average family size, the demographic groups most similar to Menominee are Malaysian (3.31, a difference of 0.11%), Immigrants from Bolivia (3.31, a difference of 0.12%), Immigrants from Pakistan (3.30, a difference of 0.15%), Immigrants from Cameroon (3.30, a difference of 0.16%), and Peruvian (3.30, a difference of 0.17%).
| Demographics | Rating | Rank | Average Family Size |
| Immigrants | Afghanistan | 99.8 /100 | #83 | Exceptional 3.32 |
| Immigrants | Nigeria | 99.7 /100 | #84 | Exceptional 3.32 |
| Afghans | 99.7 /100 | #85 | Exceptional 3.31 |
| Jamaicans | 99.7 /100 | #86 | Exceptional 3.31 |
| Immigrants | Peru | 99.7 /100 | #87 | Exceptional 3.31 |
| Immigrants | Bolivia | 99.6 /100 | #88 | Exceptional 3.31 |
| Malaysians | 99.6 /100 | #89 | Exceptional 3.31 |
| Menominee | 99.4 /100 | #90 | Exceptional 3.30 |
| Immigrants | Pakistan | 99.2 /100 | #91 | Exceptional 3.30 |
| Immigrants | Cameroon | 99.2 /100 | #92 | Exceptional 3.30 |
| Peruvians | 99.2 /100 | #93 | Exceptional 3.30 |
| Sierra Leoneans | 99.0 /100 | #94 | Exceptional 3.30 |
| Immigrants | Lebanon | 99.0 /100 | #95 | Exceptional 3.30 |
| U.S. Virgin Islanders | 98.8 /100 | #96 | Exceptional 3.29 |
| Immigrants | Oceania | 98.7 /100 | #97 | Exceptional 3.29 |
Demographics Similar to Immigrants from Canada by Average Family Size
In terms of average family size, the demographic groups most similar to Immigrants from Canada are Immigrants from Austria (3.12, a difference of 0.0%), Immigrants from North America (3.12, a difference of 0.030%), Soviet Union (3.11, a difference of 0.030%), Eastern European (3.12, a difference of 0.11%), and Welsh (3.12, a difference of 0.11%).
| Demographics | Rating | Rank | Average Family Size |
| Immigrants | Scotland | 0.1 /100 | #315 | Tragic 3.12 |
| Serbians | 0.1 /100 | #316 | Tragic 3.12 |
| Italians | 0.1 /100 | #317 | Tragic 3.12 |
| Eastern Europeans | 0.1 /100 | #318 | Tragic 3.12 |
| Welsh | 0.1 /100 | #319 | Tragic 3.12 |
| Immigrants | North America | 0.0 /100 | #320 | Tragic 3.12 |
| Immigrants | Austria | 0.0 /100 | #321 | Tragic 3.12 |
| Immigrants | Canada | 0.0 /100 | #322 | Tragic 3.12 |
| Soviet Union | 0.0 /100 | #323 | Tragic 3.11 |
| Celtics | 0.0 /100 | #324 | Tragic 3.11 |
| English | 0.0 /100 | #325 | Tragic 3.11 |
| Ottawa | 0.0 /100 | #326 | Tragic 3.11 |
| Dutch | 0.0 /100 | #327 | Tragic 3.11 |
| Czechs | 0.0 /100 | #328 | Tragic 3.11 |
| Belgians | 0.0 /100 | #329 | Tragic 3.11 |