Polish vs South American Indian Average Family Size
COMPARE
Polish
South American Indian
Average Family Size
Average Family Size Comparison
Poles
South American Indians
3.09
AVERAGE FAMILY SIZE
0.0/ 100
METRIC RATING
341st/ 347
METRIC RANK
3.26
AVERAGE FAMILY SIZE
91.6/ 100
METRIC RATING
124th/ 347
METRIC RANK
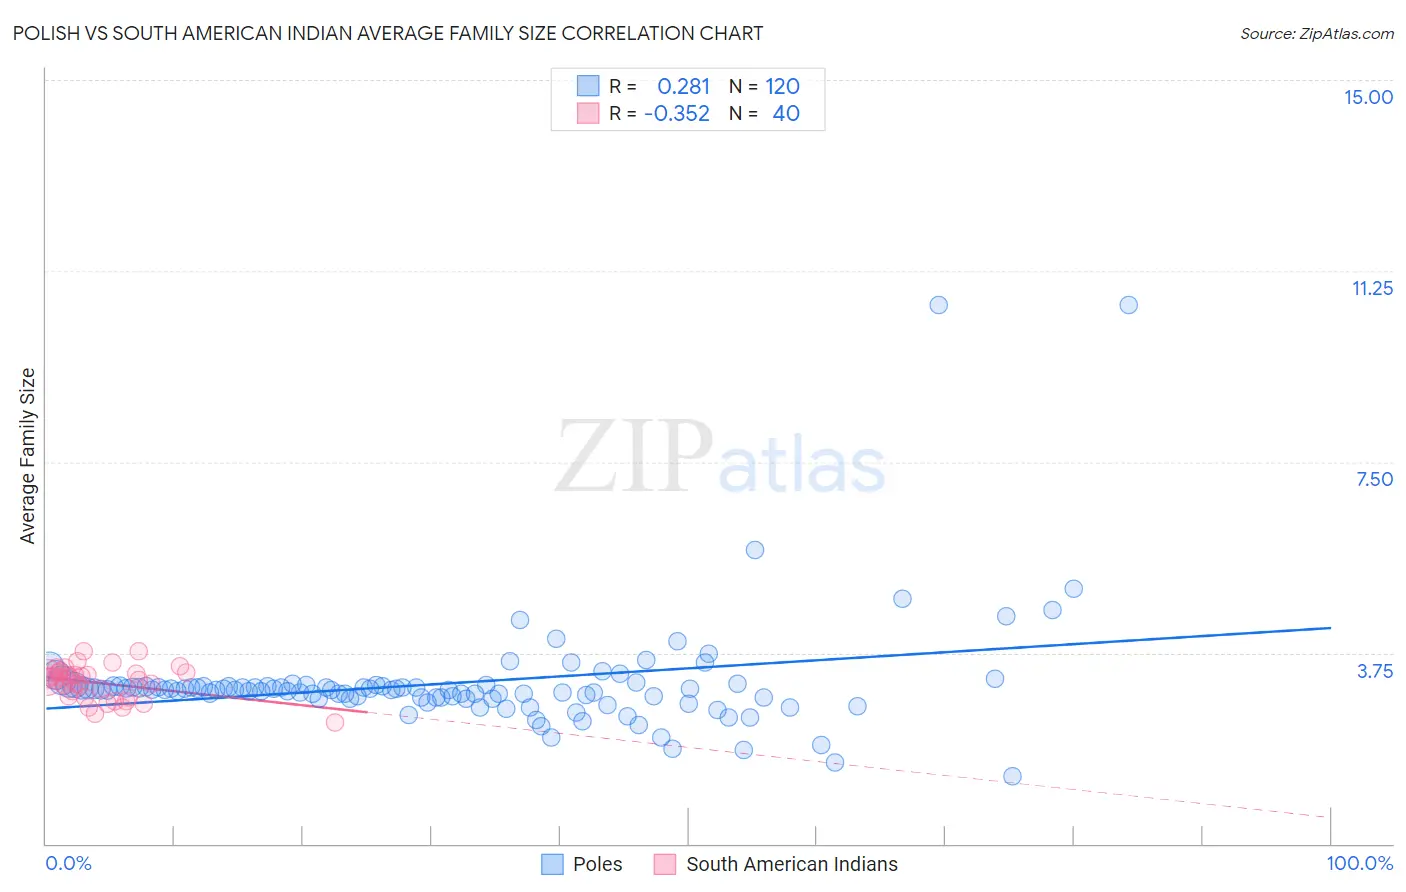
Polish vs South American Indian Average Family Size Correlation Chart
The statistical analysis conducted on geographies consisting of 559,976,913 people shows a weak positive correlation between the proportion of Poles and average family size in the United States with a correlation coefficient (R) of 0.281 and weighted average of 3.09. Similarly, the statistical analysis conducted on geographies consisting of 164,540,094 people shows a mild negative correlation between the proportion of South American Indians and average family size in the United States with a correlation coefficient (R) of -0.352 and weighted average of 3.26, a difference of 5.5%.
Average Family Size Correlation Summary
| Measurement | Polish | South American Indian |
| Minimum | 1.32 | 2.39 |
| Maximum | 10.58 | 3.79 |
| Range | 9.26 | 1.40 |
| Mean | 3.15 | 3.16 |
| Median | 3.03 | 3.26 |
| Interquartile 25% (IQ1) | 2.87 | 2.88 |
| Interquartile 75% (IQ3) | 3.10 | 3.35 |
| Interquartile Range (IQR) | 0.23 | 0.47 |
| Standard Deviation (Sample) | 1.13 | 0.32 |
| Standard Deviation (Population) | 1.13 | 0.32 |
Similar Demographics by Average Family Size
Demographics Similar to Poles by Average Family Size
In terms of average family size, the demographic groups most similar to Poles are Finnish (3.09, a difference of 0.050%), German (3.09, a difference of 0.14%), Croatian (3.10, a difference of 0.19%), French (3.10, a difference of 0.21%), and Swedish (3.10, a difference of 0.23%).
| Demographics | Rating | Rank | Average Family Size |
| Estonians | 0.0 /100 | #333 | Tragic 3.10 |
| Lithuanians | 0.0 /100 | #334 | Tragic 3.10 |
| Luxembourgers | 0.0 /100 | #335 | Tragic 3.10 |
| Irish | 0.0 /100 | #336 | Tragic 3.10 |
| Swedes | 0.0 /100 | #337 | Tragic 3.10 |
| French | 0.0 /100 | #338 | Tragic 3.10 |
| Croatians | 0.0 /100 | #339 | Tragic 3.10 |
| Finns | 0.0 /100 | #340 | Tragic 3.09 |
| Poles | 0.0 /100 | #341 | Tragic 3.09 |
| Germans | 0.0 /100 | #342 | Tragic 3.09 |
| Norwegians | 0.0 /100 | #343 | Tragic 3.08 |
| French Canadians | 0.0 /100 | #344 | Tragic 3.07 |
| Slovenes | 0.0 /100 | #345 | Tragic 3.07 |
| Slovaks | 0.0 /100 | #346 | Tragic 3.06 |
| Carpatho Rusyns | 0.0 /100 | #347 | Tragic 3.06 |
Demographics Similar to South American Indians by Average Family Size
In terms of average family size, the demographic groups most similar to South American Indians are Immigrants from Cuba (3.26, a difference of 0.020%), Alaskan Athabascan (3.27, a difference of 0.050%), Immigrants from Costa Rica (3.26, a difference of 0.050%), Immigrants from Syria (3.26, a difference of 0.060%), and Immigrants from Colombia (3.27, a difference of 0.070%).
| Demographics | Rating | Rank | Average Family Size |
| Kiowa | 94.8 /100 | #117 | Exceptional 3.27 |
| Immigrants | Asia | 94.0 /100 | #118 | Exceptional 3.27 |
| Immigrants | Indonesia | 93.7 /100 | #119 | Exceptional 3.27 |
| Immigrants | Bahamas | 93.6 /100 | #120 | Exceptional 3.27 |
| Immigrants | Thailand | 93.3 /100 | #121 | Exceptional 3.27 |
| Immigrants | Colombia | 92.8 /100 | #122 | Exceptional 3.27 |
| Alaskan Athabascans | 92.4 /100 | #123 | Exceptional 3.27 |
| South American Indians | 91.6 /100 | #124 | Exceptional 3.26 |
| Immigrants | Cuba | 91.3 /100 | #125 | Exceptional 3.26 |
| Immigrants | Costa Rica | 90.7 /100 | #126 | Exceptional 3.26 |
| Immigrants | Syria | 90.6 /100 | #127 | Exceptional 3.26 |
| Colombians | 89.9 /100 | #128 | Excellent 3.26 |
| Immigrants | Hong Kong | 88.6 /100 | #129 | Excellent 3.26 |
| Laotians | 88.5 /100 | #130 | Excellent 3.26 |
| Immigrants | Western Asia | 87.7 /100 | #131 | Excellent 3.26 |