Menominee vs South American Indian 3rd Grade
COMPARE
Menominee
South American Indian
3rd Grade
3rd Grade Comparison
Menominee
South American Indians
98.0%
3RD GRADE
95.4/ 100
METRIC RATING
114th/ 347
METRIC RANK
97.5%
3RD GRADE
5.7/ 100
METRIC RATING
217th/ 347
METRIC RANK
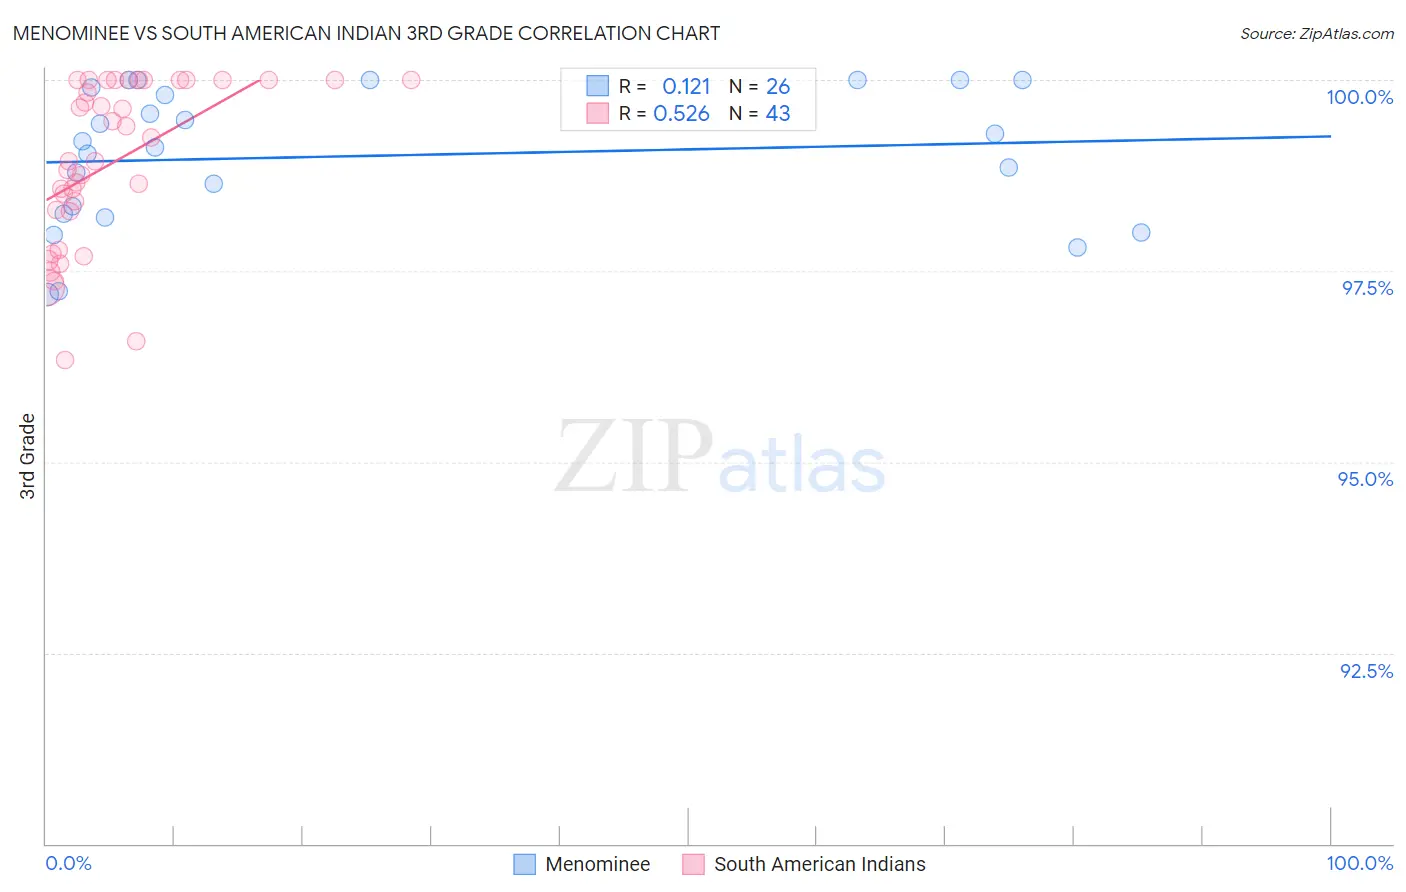
Menominee vs South American Indian 3rd Grade Correlation Chart
The statistical analysis conducted on geographies consisting of 45,778,979 people shows a poor positive correlation between the proportion of Menominee and percentage of population with at least 3rd grade education in the United States with a correlation coefficient (R) of 0.121 and weighted average of 98.0%. Similarly, the statistical analysis conducted on geographies consisting of 164,573,401 people shows a substantial positive correlation between the proportion of South American Indians and percentage of population with at least 3rd grade education in the United States with a correlation coefficient (R) of 0.526 and weighted average of 97.5%, a difference of 0.50%.
3rd Grade Correlation Summary
| Measurement | Menominee | South American Indian |
| Minimum | 97.2% | 96.3% |
| Maximum | 100.0% | 100.0% |
| Range | 2.8% | 3.7% |
| Mean | 99.0% | 98.9% |
| Median | 99.2% | 98.9% |
| Interquartile 25% (IQ1) | 98.3% | 98.3% |
| Interquartile 75% (IQ3) | 99.9% | 100.0% |
| Interquartile Range (IQR) | 1.6% | 1.7% |
| Standard Deviation (Sample) | 0.89% | 1.1% |
| Standard Deviation (Population) | 0.88% | 1.1% |
Similar Demographics by 3rd Grade
Demographics Similar to Menominee by 3rd Grade
In terms of 3rd grade, the demographic groups most similar to Menominee are Thai (98.0%, a difference of 0.0%), Okinawan (98.0%, a difference of 0.0%), Immigrants from Norway (98.0%, a difference of 0.0%), Immigrants from Latvia (98.0%, a difference of 0.010%), and Immigrants from France (98.0%, a difference of 0.010%).
| Demographics | Rating | Rank | 3rd Grade |
| Immigrants | Czechoslovakia | 97.0 /100 | #107 | Exceptional 98.0% |
| Immigrants | Singapore | 96.7 /100 | #108 | Exceptional 98.0% |
| Pima | 96.7 /100 | #109 | Exceptional 98.0% |
| Immigrants | Switzerland | 96.6 /100 | #110 | Exceptional 98.0% |
| Basques | 96.5 /100 | #111 | Exceptional 98.0% |
| Immigrants | Latvia | 96.0 /100 | #112 | Exceptional 98.0% |
| Thais | 95.5 /100 | #113 | Exceptional 98.0% |
| Menominee | 95.4 /100 | #114 | Exceptional 98.0% |
| Okinawans | 95.2 /100 | #115 | Exceptional 98.0% |
| Immigrants | Norway | 95.2 /100 | #116 | Exceptional 98.0% |
| Immigrants | France | 95.1 /100 | #117 | Exceptional 98.0% |
| Iranians | 94.9 /100 | #118 | Exceptional 98.0% |
| Spanish | 94.8 /100 | #119 | Exceptional 98.0% |
| Immigrants | Croatia | 94.4 /100 | #120 | Exceptional 98.0% |
| Iroquois | 94.1 /100 | #121 | Exceptional 98.0% |
Demographics Similar to South American Indians by 3rd Grade
In terms of 3rd grade, the demographic groups most similar to South American Indians are Immigrants from Nepal (97.5%, a difference of 0.010%), Immigrants from Panama (97.5%, a difference of 0.010%), Immigrants from Morocco (97.5%, a difference of 0.010%), Uruguayan (97.5%, a difference of 0.010%), and Iraqi (97.5%, a difference of 0.020%).
| Demographics | Rating | Rank | 3rd Grade |
| Immigrants | Oceania | 9.5 /100 | #210 | Tragic 97.6% |
| Laotians | 9.4 /100 | #211 | Tragic 97.6% |
| Immigrants | Bahamas | 8.5 /100 | #212 | Tragic 97.6% |
| Moroccans | 8.5 /100 | #213 | Tragic 97.6% |
| Yuman | 8.4 /100 | #214 | Tragic 97.6% |
| Iraqis | 6.9 /100 | #215 | Tragic 97.5% |
| Samoans | 6.9 /100 | #216 | Tragic 97.5% |
| South American Indians | 5.7 /100 | #217 | Tragic 97.5% |
| Immigrants | Nepal | 5.3 /100 | #218 | Tragic 97.5% |
| Immigrants | Panama | 5.2 /100 | #219 | Tragic 97.5% |
| Immigrants | Morocco | 5.0 /100 | #220 | Tragic 97.5% |
| Uruguayans | 5.0 /100 | #221 | Tragic 97.5% |
| Sierra Leoneans | 4.6 /100 | #222 | Tragic 97.5% |
| Immigrants | Syria | 4.4 /100 | #223 | Tragic 97.5% |
| Bahamians | 4.4 /100 | #224 | Tragic 97.5% |