Haitian vs South American Indian Average Family Size
COMPARE
Haitian
South American Indian
Average Family Size
Average Family Size Comparison
Haitians
South American Indians
3.37
AVERAGE FAMILY SIZE
100.0/ 100
METRIC RATING
46th/ 347
METRIC RANK
3.26
AVERAGE FAMILY SIZE
91.6/ 100
METRIC RATING
124th/ 347
METRIC RANK
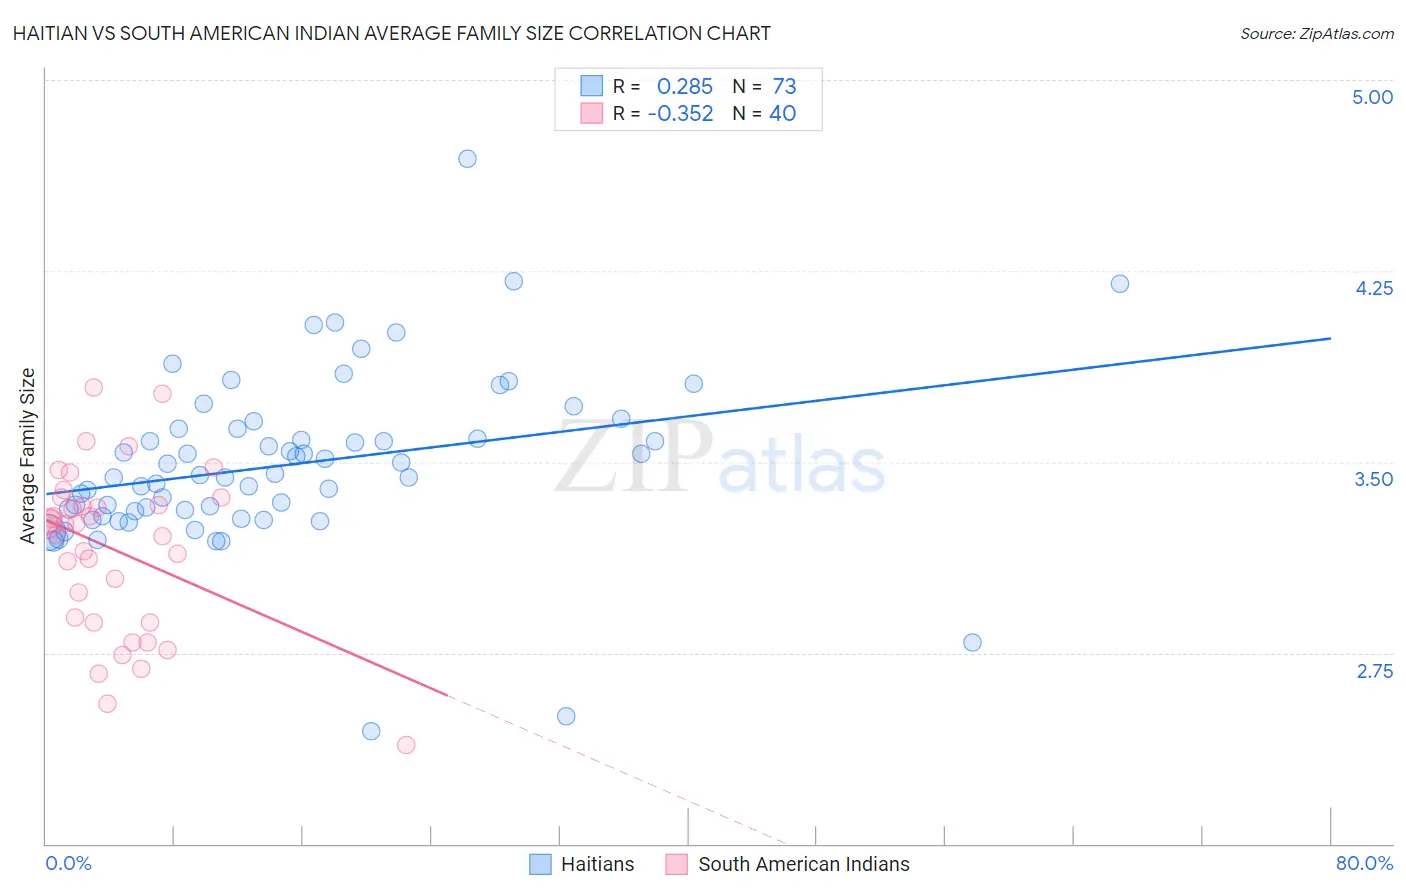
Haitian vs South American Indian Average Family Size Correlation Chart
The statistical analysis conducted on geographies consisting of 287,712,478 people shows a weak positive correlation between the proportion of Haitians and average family size in the United States with a correlation coefficient (R) of 0.285 and weighted average of 3.37. Similarly, the statistical analysis conducted on geographies consisting of 164,540,094 people shows a mild negative correlation between the proportion of South American Indians and average family size in the United States with a correlation coefficient (R) of -0.352 and weighted average of 3.26, a difference of 3.3%.
Average Family Size Correlation Summary
| Measurement | Haitian | South American Indian |
| Minimum | 2.44 | 2.39 |
| Maximum | 4.69 | 3.79 |
| Range | 2.25 | 1.40 |
| Mean | 3.49 | 3.16 |
| Median | 3.45 | 3.26 |
| Interquartile 25% (IQ1) | 3.30 | 2.88 |
| Interquartile 75% (IQ3) | 3.63 | 3.35 |
| Interquartile Range (IQR) | 0.33 | 0.47 |
| Standard Deviation (Sample) | 0.34 | 0.32 |
| Standard Deviation (Population) | 0.34 | 0.32 |
Similar Demographics by Average Family Size
Demographics Similar to Haitians by Average Family Size
In terms of average family size, the demographic groups most similar to Haitians are Vietnamese (3.37, a difference of 0.040%), Immigrants from Nicaragua (3.37, a difference of 0.040%), Shoshone (3.37, a difference of 0.060%), Alaska Native (3.37, a difference of 0.090%), and Immigrants from Philippines (3.37, a difference of 0.10%).
| Demographics | Rating | Rank | Average Family Size |
| Immigrants | Haiti | 100.0 /100 | #39 | Exceptional 3.39 |
| Belizeans | 100.0 /100 | #40 | Exceptional 3.39 |
| Marshallese | 100.0 /100 | #41 | Exceptional 3.38 |
| Immigrants | Vietnam | 100.0 /100 | #42 | Exceptional 3.38 |
| Immigrants | Philippines | 100.0 /100 | #43 | Exceptional 3.37 |
| Alaska Natives | 100.0 /100 | #44 | Exceptional 3.37 |
| Shoshone | 100.0 /100 | #45 | Exceptional 3.37 |
| Haitians | 100.0 /100 | #46 | Exceptional 3.37 |
| Vietnamese | 100.0 /100 | #47 | Exceptional 3.37 |
| Immigrants | Nicaragua | 100.0 /100 | #48 | Exceptional 3.37 |
| Bangladeshis | 100.0 /100 | #49 | Exceptional 3.37 |
| Immigrants | Bangladesh | 100.0 /100 | #50 | Exceptional 3.36 |
| Nicaraguans | 100.0 /100 | #51 | Exceptional 3.36 |
| Fijians | 100.0 /100 | #52 | Exceptional 3.36 |
| Koreans | 100.0 /100 | #53 | Exceptional 3.36 |
Demographics Similar to South American Indians by Average Family Size
In terms of average family size, the demographic groups most similar to South American Indians are Immigrants from Cuba (3.26, a difference of 0.020%), Alaskan Athabascan (3.27, a difference of 0.050%), Immigrants from Costa Rica (3.26, a difference of 0.050%), Immigrants from Syria (3.26, a difference of 0.060%), and Immigrants from Colombia (3.27, a difference of 0.070%).
| Demographics | Rating | Rank | Average Family Size |
| Kiowa | 94.8 /100 | #117 | Exceptional 3.27 |
| Immigrants | Asia | 94.0 /100 | #118 | Exceptional 3.27 |
| Immigrants | Indonesia | 93.7 /100 | #119 | Exceptional 3.27 |
| Immigrants | Bahamas | 93.6 /100 | #120 | Exceptional 3.27 |
| Immigrants | Thailand | 93.3 /100 | #121 | Exceptional 3.27 |
| Immigrants | Colombia | 92.8 /100 | #122 | Exceptional 3.27 |
| Alaskan Athabascans | 92.4 /100 | #123 | Exceptional 3.27 |
| South American Indians | 91.6 /100 | #124 | Exceptional 3.26 |
| Immigrants | Cuba | 91.3 /100 | #125 | Exceptional 3.26 |
| Immigrants | Costa Rica | 90.7 /100 | #126 | Exceptional 3.26 |
| Immigrants | Syria | 90.6 /100 | #127 | Exceptional 3.26 |
| Colombians | 89.9 /100 | #128 | Excellent 3.26 |
| Immigrants | Hong Kong | 88.6 /100 | #129 | Excellent 3.26 |
| Laotians | 88.5 /100 | #130 | Excellent 3.26 |
| Immigrants | Western Asia | 87.7 /100 | #131 | Excellent 3.26 |