Menominee vs Panamanian Average Family Size
COMPARE
Menominee
Panamanian
Average Family Size
Average Family Size Comparison
Menominee
Panamanians
3.30
AVERAGE FAMILY SIZE
99.4/ 100
METRIC RATING
90th/ 347
METRIC RANK
3.25
AVERAGE FAMILY SIZE
84.2/ 100
METRIC RATING
135th/ 347
METRIC RANK
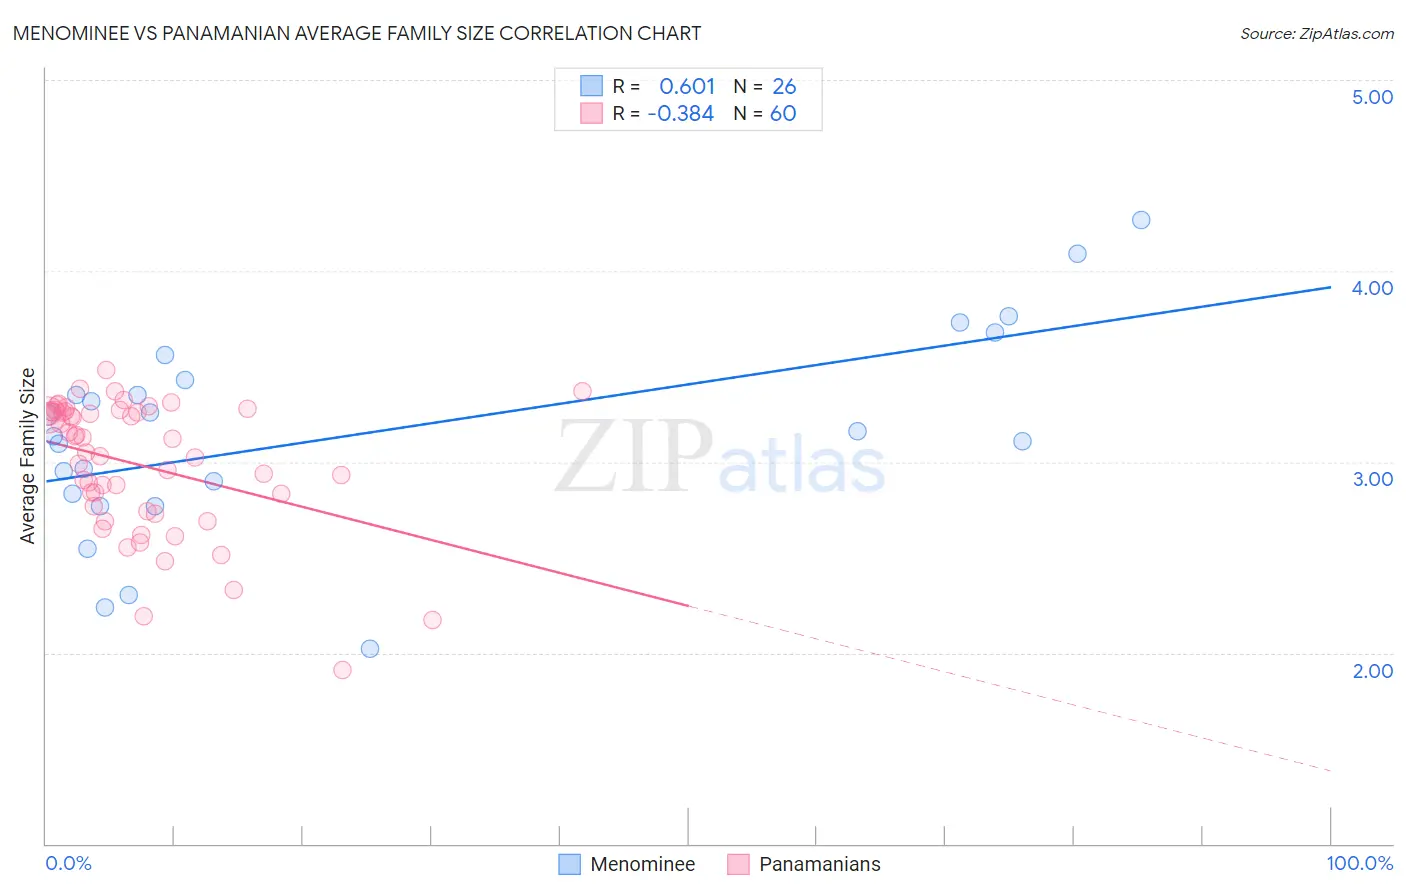
Menominee vs Panamanian Average Family Size Correlation Chart
The statistical analysis conducted on geographies consisting of 45,777,849 people shows a significant positive correlation between the proportion of Menominee and average family size in the United States with a correlation coefficient (R) of 0.601 and weighted average of 3.30. Similarly, the statistical analysis conducted on geographies consisting of 281,072,582 people shows a mild negative correlation between the proportion of Panamanians and average family size in the United States with a correlation coefficient (R) of -0.384 and weighted average of 3.25, a difference of 1.6%.
Average Family Size Correlation Summary
| Measurement | Menominee | Panamanian |
| Minimum | 2.02 | 1.91 |
| Maximum | 4.27 | 3.48 |
| Range | 2.25 | 1.57 |
| Mean | 3.15 | 2.98 |
| Median | 3.15 | 3.08 |
| Interquartile 25% (IQ1) | 2.83 | 2.75 |
| Interquartile 75% (IQ3) | 3.43 | 3.26 |
| Interquartile Range (IQR) | 0.60 | 0.51 |
| Standard Deviation (Sample) | 0.54 | 0.35 |
| Standard Deviation (Population) | 0.53 | 0.34 |
Similar Demographics by Average Family Size
Demographics Similar to Menominee by Average Family Size
In terms of average family size, the demographic groups most similar to Menominee are Malaysian (3.31, a difference of 0.11%), Immigrants from Bolivia (3.31, a difference of 0.12%), Immigrants from Pakistan (3.30, a difference of 0.15%), Immigrants from Cameroon (3.30, a difference of 0.16%), and Peruvian (3.30, a difference of 0.17%).
| Demographics | Rating | Rank | Average Family Size |
| Immigrants | Afghanistan | 99.8 /100 | #83 | Exceptional 3.32 |
| Immigrants | Nigeria | 99.7 /100 | #84 | Exceptional 3.32 |
| Afghans | 99.7 /100 | #85 | Exceptional 3.31 |
| Jamaicans | 99.7 /100 | #86 | Exceptional 3.31 |
| Immigrants | Peru | 99.7 /100 | #87 | Exceptional 3.31 |
| Immigrants | Bolivia | 99.6 /100 | #88 | Exceptional 3.31 |
| Malaysians | 99.6 /100 | #89 | Exceptional 3.31 |
| Menominee | 99.4 /100 | #90 | Exceptional 3.30 |
| Immigrants | Pakistan | 99.2 /100 | #91 | Exceptional 3.30 |
| Immigrants | Cameroon | 99.2 /100 | #92 | Exceptional 3.30 |
| Peruvians | 99.2 /100 | #93 | Exceptional 3.30 |
| Sierra Leoneans | 99.0 /100 | #94 | Exceptional 3.30 |
| Immigrants | Lebanon | 99.0 /100 | #95 | Exceptional 3.30 |
| U.S. Virgin Islanders | 98.8 /100 | #96 | Exceptional 3.29 |
| Immigrants | Oceania | 98.7 /100 | #97 | Exceptional 3.29 |
Demographics Similar to Panamanians by Average Family Size
In terms of average family size, the demographic groups most similar to Panamanians are African (3.25, a difference of 0.020%), Comanche (3.25, a difference of 0.050%), Immigrants from Middle Africa (3.25, a difference of 0.060%), Immigrants from Venezuela (3.26, a difference of 0.070%), and Cuban (3.25, a difference of 0.080%).
| Demographics | Rating | Rank | Average Family Size |
| Colombians | 89.9 /100 | #128 | Excellent 3.26 |
| Immigrants | Hong Kong | 88.6 /100 | #129 | Excellent 3.26 |
| Laotians | 88.5 /100 | #130 | Excellent 3.26 |
| Immigrants | Western Asia | 87.7 /100 | #131 | Excellent 3.26 |
| Costa Ricans | 86.8 /100 | #132 | Excellent 3.26 |
| Immigrants | Venezuela | 86.3 /100 | #133 | Excellent 3.26 |
| Africans | 84.9 /100 | #134 | Excellent 3.25 |
| Panamanians | 84.2 /100 | #135 | Excellent 3.25 |
| Comanche | 82.8 /100 | #136 | Excellent 3.25 |
| Immigrants | Middle Africa | 82.4 /100 | #137 | Excellent 3.25 |
| Cubans | 81.8 /100 | #138 | Excellent 3.25 |
| Immigrants | Ethiopia | 81.6 /100 | #139 | Excellent 3.25 |
| Sub-Saharan Africans | 81.6 /100 | #140 | Excellent 3.25 |
| Venezuelans | 81.4 /100 | #141 | Excellent 3.25 |
| Liberians | 81.2 /100 | #142 | Excellent 3.25 |