Menominee vs Immigrants from Dominica Average Family Size
COMPARE
Menominee
Immigrants from Dominica
Average Family Size
Average Family Size Comparison
Menominee
Immigrants from Dominica
3.30
AVERAGE FAMILY SIZE
99.4/ 100
METRIC RATING
90th/ 347
METRIC RANK
3.32
AVERAGE FAMILY SIZE
99.8/ 100
METRIC RATING
81st/ 347
METRIC RANK
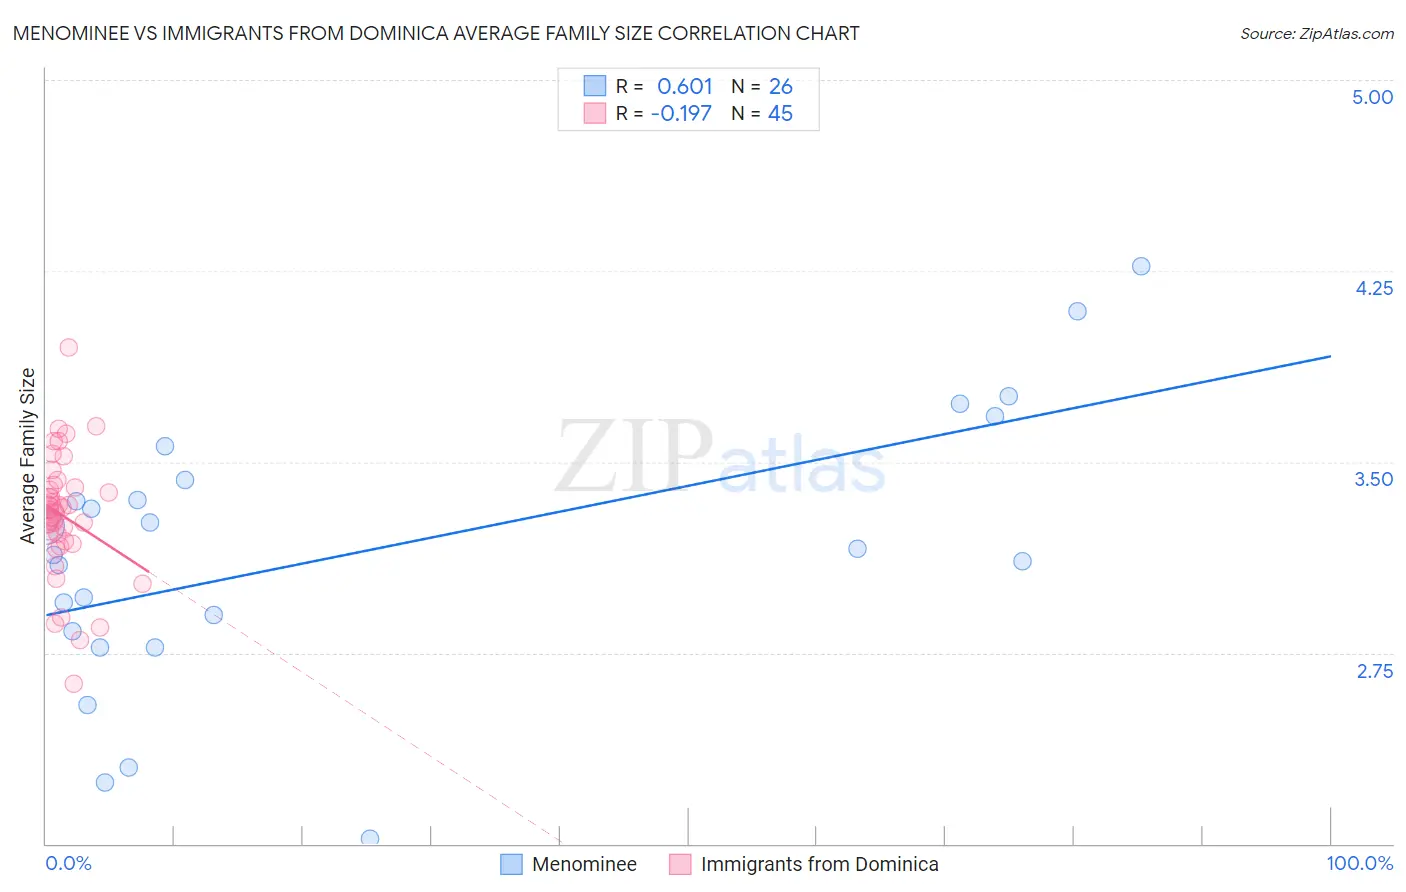
Menominee vs Immigrants from Dominica Average Family Size Correlation Chart
The statistical analysis conducted on geographies consisting of 45,777,849 people shows a significant positive correlation between the proportion of Menominee and average family size in the United States with a correlation coefficient (R) of 0.601 and weighted average of 3.30. Similarly, the statistical analysis conducted on geographies consisting of 83,787,434 people shows a poor negative correlation between the proportion of Immigrants from Dominica and average family size in the United States with a correlation coefficient (R) of -0.197 and weighted average of 3.32, a difference of 0.41%.
Average Family Size Correlation Summary
| Measurement | Menominee | Immigrants from Dominica |
| Minimum | 2.02 | 2.63 |
| Maximum | 4.27 | 3.95 |
| Range | 2.25 | 1.32 |
| Mean | 3.15 | 3.29 |
| Median | 3.15 | 3.30 |
| Interquartile 25% (IQ1) | 2.83 | 3.19 |
| Interquartile 75% (IQ3) | 3.43 | 3.41 |
| Interquartile Range (IQR) | 0.60 | 0.22 |
| Standard Deviation (Sample) | 0.54 | 0.24 |
| Standard Deviation (Population) | 0.53 | 0.24 |
Demographics Similar to Menominee and Immigrants from Dominica by Average Family Size
In terms of average family size, the demographic groups most similar to Menominee are Malaysian (3.31, a difference of 0.11%), Immigrants from Bolivia (3.31, a difference of 0.12%), Immigrants from Pakistan (3.30, a difference of 0.15%), Immigrants from Cameroon (3.30, a difference of 0.16%), and Peruvian (3.30, a difference of 0.17%). Similarly, the demographic groups most similar to Immigrants from Dominica are Lumbee (3.32, a difference of 0.040%), Ecuadorian (3.32, a difference of 0.040%), Immigrants from Afghanistan (3.32, a difference of 0.050%), British West Indian (3.32, a difference of 0.060%), and Immigrants from Micronesia (3.32, a difference of 0.070%).
| Demographics | Rating | Rank | Average Family Size |
| Immigrants | Barbados | 99.8 /100 | #75 | Exceptional 3.32 |
| Trinidadians and Tobagonians | 99.8 /100 | #76 | Exceptional 3.32 |
| Immigrants | Ecuador | 99.8 /100 | #77 | Exceptional 3.32 |
| Immigrants | Micronesia | 99.8 /100 | #78 | Exceptional 3.32 |
| British West Indians | 99.8 /100 | #79 | Exceptional 3.32 |
| Lumbee | 99.8 /100 | #80 | Exceptional 3.32 |
| Immigrants | Dominica | 99.8 /100 | #81 | Exceptional 3.32 |
| Ecuadorians | 99.8 /100 | #82 | Exceptional 3.32 |
| Immigrants | Afghanistan | 99.8 /100 | #83 | Exceptional 3.32 |
| Immigrants | Nigeria | 99.7 /100 | #84 | Exceptional 3.32 |
| Afghans | 99.7 /100 | #85 | Exceptional 3.31 |
| Jamaicans | 99.7 /100 | #86 | Exceptional 3.31 |
| Immigrants | Peru | 99.7 /100 | #87 | Exceptional 3.31 |
| Immigrants | Bolivia | 99.6 /100 | #88 | Exceptional 3.31 |
| Malaysians | 99.6 /100 | #89 | Exceptional 3.31 |
| Menominee | 99.4 /100 | #90 | Exceptional 3.30 |
| Immigrants | Pakistan | 99.2 /100 | #91 | Exceptional 3.30 |
| Immigrants | Cameroon | 99.2 /100 | #92 | Exceptional 3.30 |
| Peruvians | 99.2 /100 | #93 | Exceptional 3.30 |
| Sierra Leoneans | 99.0 /100 | #94 | Exceptional 3.30 |
| Immigrants | Lebanon | 99.0 /100 | #95 | Exceptional 3.30 |