Menominee vs Slavic Average Family Size
COMPARE
Menominee
Slavic
Average Family Size
Average Family Size Comparison
Menominee
Slavs
3.30
AVERAGE FAMILY SIZE
99.4/ 100
METRIC RATING
90th/ 347
METRIC RANK
3.13
AVERAGE FAMILY SIZE
0.1/ 100
METRIC RATING
308th/ 347
METRIC RANK
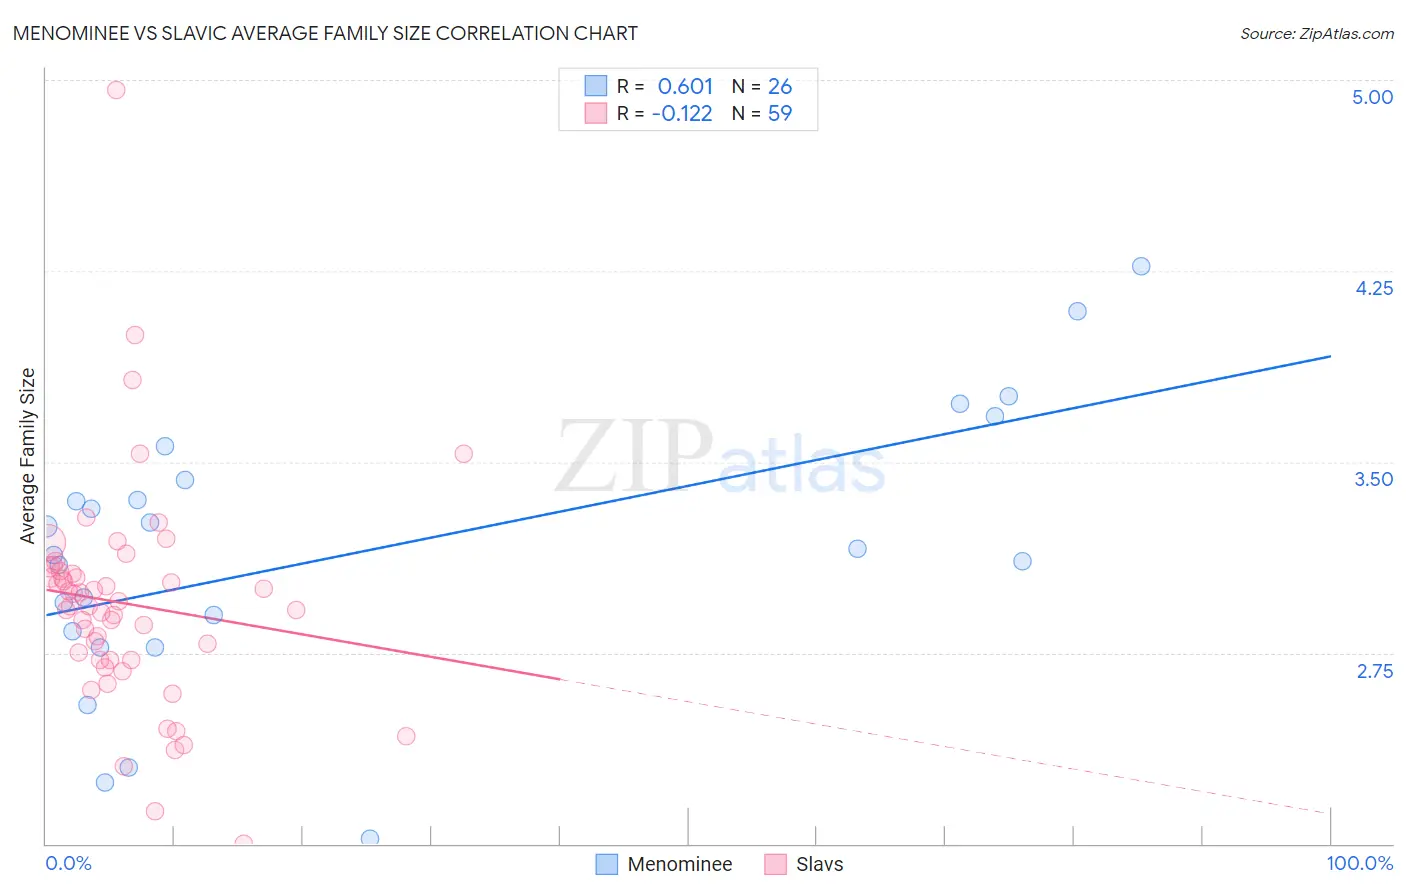
Menominee vs Slavic Average Family Size Correlation Chart
The statistical analysis conducted on geographies consisting of 45,777,849 people shows a significant positive correlation between the proportion of Menominee and average family size in the United States with a correlation coefficient (R) of 0.601 and weighted average of 3.30. Similarly, the statistical analysis conducted on geographies consisting of 270,815,552 people shows a poor negative correlation between the proportion of Slavs and average family size in the United States with a correlation coefficient (R) of -0.122 and weighted average of 3.13, a difference of 5.6%.
Average Family Size Correlation Summary
| Measurement | Menominee | Slavic |
| Minimum | 2.02 | 2.00 |
| Maximum | 4.27 | 4.96 |
| Range | 2.25 | 2.96 |
| Mean | 3.15 | 2.94 |
| Median | 3.15 | 2.93 |
| Interquartile 25% (IQ1) | 2.83 | 2.72 |
| Interquartile 75% (IQ3) | 3.43 | 3.07 |
| Interquartile Range (IQR) | 0.60 | 0.35 |
| Standard Deviation (Sample) | 0.54 | 0.44 |
| Standard Deviation (Population) | 0.53 | 0.44 |
Similar Demographics by Average Family Size
Demographics Similar to Menominee by Average Family Size
In terms of average family size, the demographic groups most similar to Menominee are Malaysian (3.31, a difference of 0.11%), Immigrants from Bolivia (3.31, a difference of 0.12%), Immigrants from Pakistan (3.30, a difference of 0.15%), Immigrants from Cameroon (3.30, a difference of 0.16%), and Peruvian (3.30, a difference of 0.17%).
| Demographics | Rating | Rank | Average Family Size |
| Immigrants | Afghanistan | 99.8 /100 | #83 | Exceptional 3.32 |
| Immigrants | Nigeria | 99.7 /100 | #84 | Exceptional 3.32 |
| Afghans | 99.7 /100 | #85 | Exceptional 3.31 |
| Jamaicans | 99.7 /100 | #86 | Exceptional 3.31 |
| Immigrants | Peru | 99.7 /100 | #87 | Exceptional 3.31 |
| Immigrants | Bolivia | 99.6 /100 | #88 | Exceptional 3.31 |
| Malaysians | 99.6 /100 | #89 | Exceptional 3.31 |
| Menominee | 99.4 /100 | #90 | Exceptional 3.30 |
| Immigrants | Pakistan | 99.2 /100 | #91 | Exceptional 3.30 |
| Immigrants | Cameroon | 99.2 /100 | #92 | Exceptional 3.30 |
| Peruvians | 99.2 /100 | #93 | Exceptional 3.30 |
| Sierra Leoneans | 99.0 /100 | #94 | Exceptional 3.30 |
| Immigrants | Lebanon | 99.0 /100 | #95 | Exceptional 3.30 |
| U.S. Virgin Islanders | 98.8 /100 | #96 | Exceptional 3.29 |
| Immigrants | Oceania | 98.7 /100 | #97 | Exceptional 3.29 |
Demographics Similar to Slavs by Average Family Size
In terms of average family size, the demographic groups most similar to Slavs are Northern European (3.13, a difference of 0.010%), Czechoslovakian (3.13, a difference of 0.030%), Immigrants from Serbia (3.13, a difference of 0.050%), Immigrants from Ireland (3.13, a difference of 0.060%), and Immigrants from Northern Europe (3.13, a difference of 0.070%).
| Demographics | Rating | Rank | Average Family Size |
| Macedonians | 0.2 /100 | #301 | Tragic 3.13 |
| Immigrants | Latvia | 0.2 /100 | #302 | Tragic 3.13 |
| British | 0.2 /100 | #303 | Tragic 3.13 |
| Immigrants | Switzerland | 0.2 /100 | #304 | Tragic 3.13 |
| Australians | 0.1 /100 | #305 | Tragic 3.13 |
| Immigrants | Ireland | 0.1 /100 | #306 | Tragic 3.13 |
| Immigrants | Serbia | 0.1 /100 | #307 | Tragic 3.13 |
| Slavs | 0.1 /100 | #308 | Tragic 3.13 |
| Northern Europeans | 0.1 /100 | #309 | Tragic 3.13 |
| Czechoslovakians | 0.1 /100 | #310 | Tragic 3.13 |
| Immigrants | Northern Europe | 0.1 /100 | #311 | Tragic 3.13 |
| Immigrants | Australia | 0.1 /100 | #312 | Tragic 3.13 |
| Bulgarians | 0.1 /100 | #313 | Tragic 3.13 |
| Russians | 0.1 /100 | #314 | Tragic 3.12 |
| Immigrants | Scotland | 0.1 /100 | #315 | Tragic 3.12 |