Menominee vs South American Average Family Size
COMPARE
Menominee
South American
Average Family Size
Average Family Size Comparison
Menominee
South Americans
3.30
AVERAGE FAMILY SIZE
99.4/ 100
METRIC RATING
90th/ 347
METRIC RANK
3.27
AVERAGE FAMILY SIZE
95.1/ 100
METRIC RATING
114th/ 347
METRIC RANK
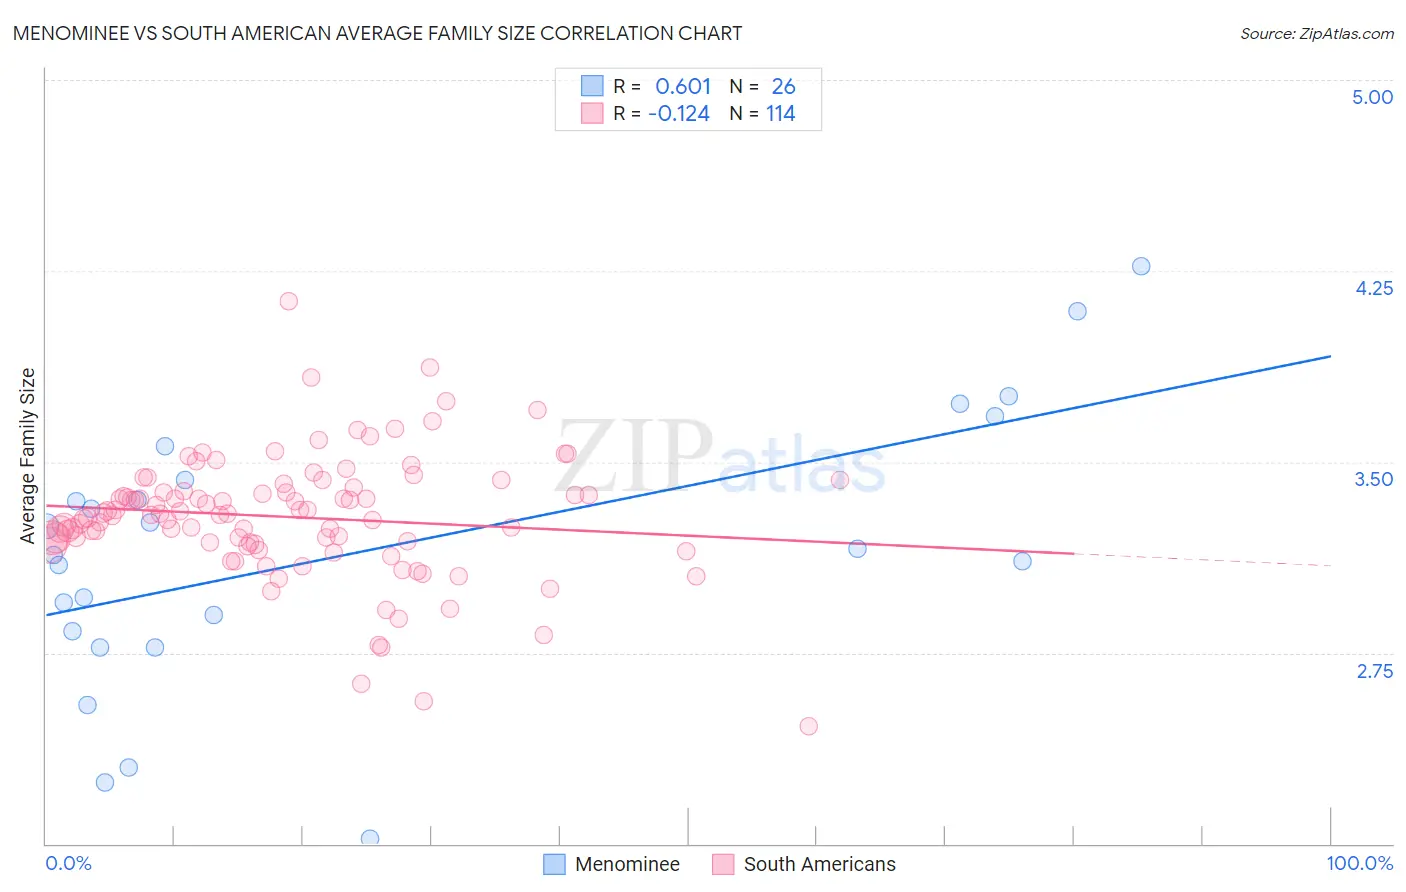
Menominee vs South American Average Family Size Correlation Chart
The statistical analysis conducted on geographies consisting of 45,777,849 people shows a significant positive correlation between the proportion of Menominee and average family size in the United States with a correlation coefficient (R) of 0.601 and weighted average of 3.30. Similarly, the statistical analysis conducted on geographies consisting of 493,671,648 people shows a poor negative correlation between the proportion of South Americans and average family size in the United States with a correlation coefficient (R) of -0.124 and weighted average of 3.27, a difference of 1.0%.
Average Family Size Correlation Summary
| Measurement | Menominee | South American |
| Minimum | 2.02 | 2.46 |
| Maximum | 4.27 | 4.13 |
| Range | 2.25 | 1.67 |
| Mean | 3.15 | 3.28 |
| Median | 3.15 | 3.29 |
| Interquartile 25% (IQ1) | 2.83 | 3.18 |
| Interquartile 75% (IQ3) | 3.43 | 3.39 |
| Interquartile Range (IQR) | 0.60 | 0.20 |
| Standard Deviation (Sample) | 0.54 | 0.24 |
| Standard Deviation (Population) | 0.53 | 0.24 |
Similar Demographics by Average Family Size
Demographics Similar to Menominee by Average Family Size
In terms of average family size, the demographic groups most similar to Menominee are Malaysian (3.31, a difference of 0.11%), Immigrants from Bolivia (3.31, a difference of 0.12%), Immigrants from Pakistan (3.30, a difference of 0.15%), Immigrants from Cameroon (3.30, a difference of 0.16%), and Peruvian (3.30, a difference of 0.17%).
| Demographics | Rating | Rank | Average Family Size |
| Immigrants | Afghanistan | 99.8 /100 | #83 | Exceptional 3.32 |
| Immigrants | Nigeria | 99.7 /100 | #84 | Exceptional 3.32 |
| Afghans | 99.7 /100 | #85 | Exceptional 3.31 |
| Jamaicans | 99.7 /100 | #86 | Exceptional 3.31 |
| Immigrants | Peru | 99.7 /100 | #87 | Exceptional 3.31 |
| Immigrants | Bolivia | 99.6 /100 | #88 | Exceptional 3.31 |
| Malaysians | 99.6 /100 | #89 | Exceptional 3.31 |
| Menominee | 99.4 /100 | #90 | Exceptional 3.30 |
| Immigrants | Pakistan | 99.2 /100 | #91 | Exceptional 3.30 |
| Immigrants | Cameroon | 99.2 /100 | #92 | Exceptional 3.30 |
| Peruvians | 99.2 /100 | #93 | Exceptional 3.30 |
| Sierra Leoneans | 99.0 /100 | #94 | Exceptional 3.30 |
| Immigrants | Lebanon | 99.0 /100 | #95 | Exceptional 3.30 |
| U.S. Virgin Islanders | 98.8 /100 | #96 | Exceptional 3.29 |
| Immigrants | Oceania | 98.7 /100 | #97 | Exceptional 3.29 |
Demographics Similar to South Americans by Average Family Size
In terms of average family size, the demographic groups most similar to South Americans are Immigrants from Liberia (3.27, a difference of 0.010%), Immigrants from South America (3.27, a difference of 0.010%), Kiowa (3.27, a difference of 0.030%), Immigrants from Panama (3.27, a difference of 0.050%), and Black/African American (3.27, a difference of 0.060%).
| Demographics | Rating | Rank | Average Family Size |
| Ghanaians | 98.0 /100 | #107 | Exceptional 3.29 |
| Asians | 97.0 /100 | #108 | Exceptional 3.28 |
| Puerto Ricans | 96.7 /100 | #109 | Exceptional 3.28 |
| Bahamians | 96.6 /100 | #110 | Exceptional 3.28 |
| Indonesians | 96.2 /100 | #111 | Exceptional 3.28 |
| Blacks/African Americans | 95.7 /100 | #112 | Exceptional 3.27 |
| Immigrants | Panama | 95.6 /100 | #113 | Exceptional 3.27 |
| South Americans | 95.1 /100 | #114 | Exceptional 3.27 |
| Immigrants | Liberia | 95.0 /100 | #115 | Exceptional 3.27 |
| Immigrants | South America | 95.0 /100 | #116 | Exceptional 3.27 |
| Kiowa | 94.8 /100 | #117 | Exceptional 3.27 |
| Immigrants | Asia | 94.0 /100 | #118 | Exceptional 3.27 |
| Immigrants | Indonesia | 93.7 /100 | #119 | Exceptional 3.27 |
| Immigrants | Bahamas | 93.6 /100 | #120 | Exceptional 3.27 |
| Immigrants | Thailand | 93.3 /100 | #121 | Exceptional 3.27 |