Serbian vs South American Indian Average Family Size
COMPARE
Serbian
South American Indian
Average Family Size
Average Family Size Comparison
Serbians
South American Indians
3.12
AVERAGE FAMILY SIZE
0.1/ 100
METRIC RATING
316th/ 347
METRIC RANK
3.26
AVERAGE FAMILY SIZE
91.6/ 100
METRIC RATING
124th/ 347
METRIC RANK
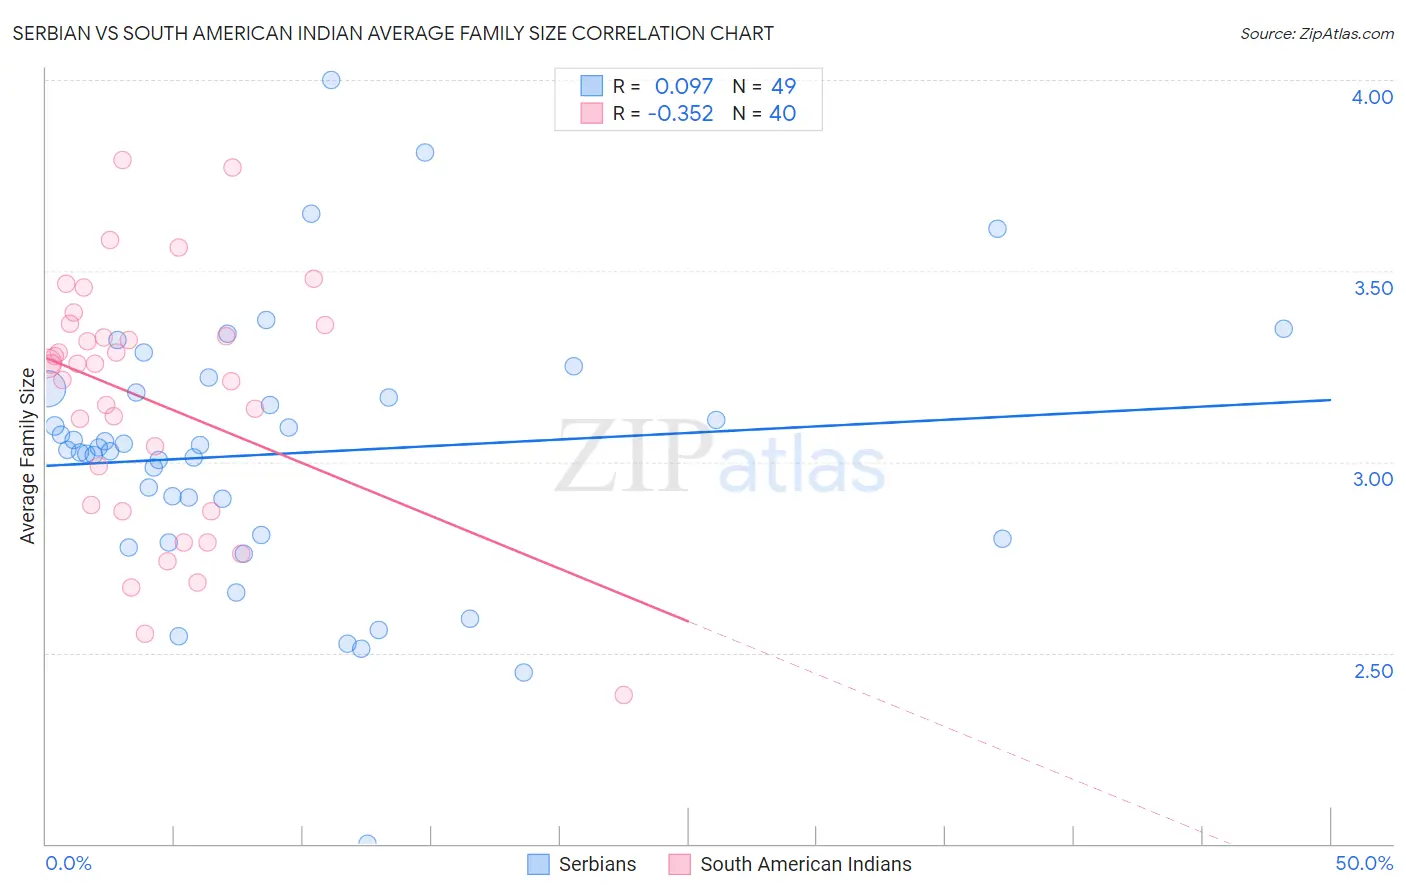
Serbian vs South American Indian Average Family Size Correlation Chart
The statistical analysis conducted on geographies consisting of 267,532,826 people shows a slight positive correlation between the proportion of Serbians and average family size in the United States with a correlation coefficient (R) of 0.097 and weighted average of 3.12. Similarly, the statistical analysis conducted on geographies consisting of 164,540,094 people shows a mild negative correlation between the proportion of South American Indians and average family size in the United States with a correlation coefficient (R) of -0.352 and weighted average of 3.26, a difference of 4.6%.
Average Family Size Correlation Summary
| Measurement | Serbian | South American Indian |
| Minimum | 2.00 | 2.39 |
| Maximum | 4.00 | 3.79 |
| Range | 2.00 | 1.40 |
| Mean | 3.02 | 3.16 |
| Median | 3.03 | 3.26 |
| Interquartile 25% (IQ1) | 2.81 | 2.88 |
| Interquartile 75% (IQ3) | 3.19 | 3.35 |
| Interquartile Range (IQR) | 0.38 | 0.47 |
| Standard Deviation (Sample) | 0.35 | 0.32 |
| Standard Deviation (Population) | 0.35 | 0.32 |
Similar Demographics by Average Family Size
Demographics Similar to Serbians by Average Family Size
In terms of average family size, the demographic groups most similar to Serbians are Italian (3.12, a difference of 0.060%), Eastern European (3.12, a difference of 0.070%), Welsh (3.12, a difference of 0.070%), Immigrants from Scotland (3.12, a difference of 0.090%), and Russian (3.12, a difference of 0.11%).
| Demographics | Rating | Rank | Average Family Size |
| Northern Europeans | 0.1 /100 | #309 | Tragic 3.13 |
| Czechoslovakians | 0.1 /100 | #310 | Tragic 3.13 |
| Immigrants | Northern Europe | 0.1 /100 | #311 | Tragic 3.13 |
| Immigrants | Australia | 0.1 /100 | #312 | Tragic 3.13 |
| Bulgarians | 0.1 /100 | #313 | Tragic 3.13 |
| Russians | 0.1 /100 | #314 | Tragic 3.12 |
| Immigrants | Scotland | 0.1 /100 | #315 | Tragic 3.12 |
| Serbians | 0.1 /100 | #316 | Tragic 3.12 |
| Italians | 0.1 /100 | #317 | Tragic 3.12 |
| Eastern Europeans | 0.1 /100 | #318 | Tragic 3.12 |
| Welsh | 0.1 /100 | #319 | Tragic 3.12 |
| Immigrants | North America | 0.0 /100 | #320 | Tragic 3.12 |
| Immigrants | Austria | 0.0 /100 | #321 | Tragic 3.12 |
| Immigrants | Canada | 0.0 /100 | #322 | Tragic 3.12 |
| Soviet Union | 0.0 /100 | #323 | Tragic 3.11 |
Demographics Similar to South American Indians by Average Family Size
In terms of average family size, the demographic groups most similar to South American Indians are Immigrants from Cuba (3.26, a difference of 0.020%), Alaskan Athabascan (3.27, a difference of 0.050%), Immigrants from Costa Rica (3.26, a difference of 0.050%), Immigrants from Syria (3.26, a difference of 0.060%), and Immigrants from Colombia (3.27, a difference of 0.070%).
| Demographics | Rating | Rank | Average Family Size |
| Kiowa | 94.8 /100 | #117 | Exceptional 3.27 |
| Immigrants | Asia | 94.0 /100 | #118 | Exceptional 3.27 |
| Immigrants | Indonesia | 93.7 /100 | #119 | Exceptional 3.27 |
| Immigrants | Bahamas | 93.6 /100 | #120 | Exceptional 3.27 |
| Immigrants | Thailand | 93.3 /100 | #121 | Exceptional 3.27 |
| Immigrants | Colombia | 92.8 /100 | #122 | Exceptional 3.27 |
| Alaskan Athabascans | 92.4 /100 | #123 | Exceptional 3.27 |
| South American Indians | 91.6 /100 | #124 | Exceptional 3.26 |
| Immigrants | Cuba | 91.3 /100 | #125 | Exceptional 3.26 |
| Immigrants | Costa Rica | 90.7 /100 | #126 | Exceptional 3.26 |
| Immigrants | Syria | 90.6 /100 | #127 | Exceptional 3.26 |
| Colombians | 89.9 /100 | #128 | Excellent 3.26 |
| Immigrants | Hong Kong | 88.6 /100 | #129 | Excellent 3.26 |
| Laotians | 88.5 /100 | #130 | Excellent 3.26 |
| Immigrants | Western Asia | 87.7 /100 | #131 | Excellent 3.26 |