Menominee vs South American Indian Vision Disability
COMPARE
Menominee
South American Indian
Vision Disability
Vision Disability Comparison
Menominee
South American Indians
2.5%
VISION DISABILITY
0.0/ 100
METRIC RATING
301st/ 347
METRIC RANK
2.2%
VISION DISABILITY
57.4/ 100
METRIC RATING
169th/ 347
METRIC RANK
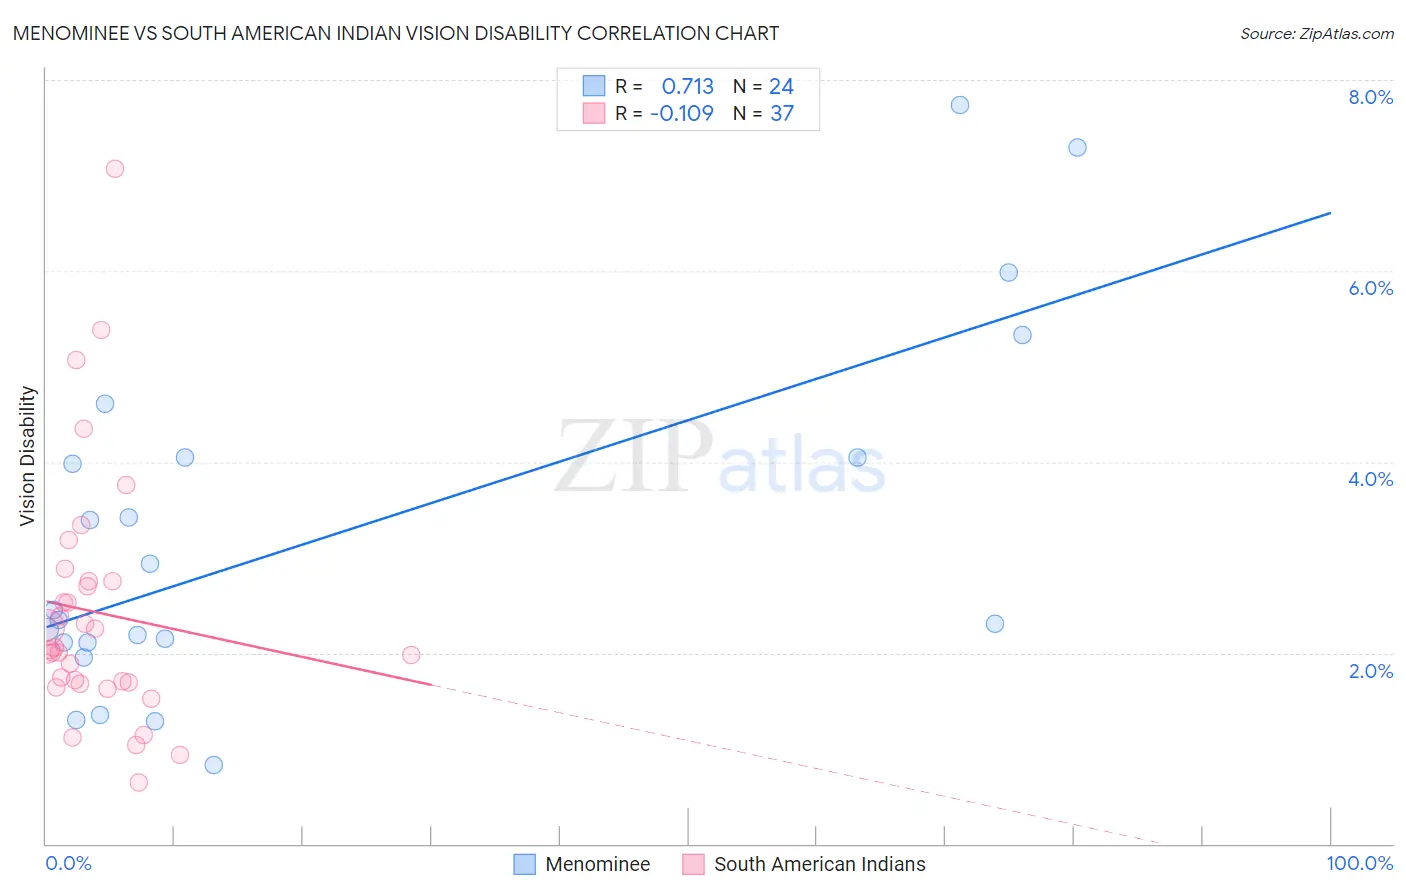
Menominee vs South American Indian Vision Disability Correlation Chart
The statistical analysis conducted on geographies consisting of 45,774,970 people shows a strong positive correlation between the proportion of Menominee and percentage of population with vision disability in the United States with a correlation coefficient (R) of 0.713 and weighted average of 2.5%. Similarly, the statistical analysis conducted on geographies consisting of 164,540,973 people shows a poor negative correlation between the proportion of South American Indians and percentage of population with vision disability in the United States with a correlation coefficient (R) of -0.109 and weighted average of 2.2%, a difference of 18.0%.
Vision Disability Correlation Summary
| Measurement | Menominee | South American Indian |
| Minimum | 0.83% | 0.64% |
| Maximum | 7.7% | 7.1% |
| Range | 6.9% | 6.4% |
| Mean | 3.2% | 2.4% |
| Median | 2.4% | 2.0% |
| Interquartile 25% (IQ1) | 2.1% | 1.7% |
| Interquartile 75% (IQ3) | 4.0% | 2.8% |
| Interquartile Range (IQR) | 1.9% | 1.1% |
| Standard Deviation (Sample) | 1.9% | 1.3% |
| Standard Deviation (Population) | 1.8% | 1.3% |
Similar Demographics by Vision Disability
Demographics Similar to Menominee by Vision Disability
In terms of vision disability, the demographic groups most similar to Menominee are African (2.5%, a difference of 0.18%), Cree (2.5%, a difference of 0.38%), Mexican (2.5%, a difference of 0.41%), Immigrants from Dominica (2.5%, a difference of 0.55%), and Immigrants from Mexico (2.5%, a difference of 1.2%).
| Demographics | Rating | Rank | Vision Disability |
| Ottawa | 0.0 /100 | #294 | Tragic 2.5% |
| Delaware | 0.0 /100 | #295 | Tragic 2.5% |
| Immigrants | Mexico | 0.0 /100 | #296 | Tragic 2.5% |
| Immigrants | Dominica | 0.0 /100 | #297 | Tragic 2.5% |
| Mexicans | 0.0 /100 | #298 | Tragic 2.5% |
| Cree | 0.0 /100 | #299 | Tragic 2.5% |
| Africans | 0.0 /100 | #300 | Tragic 2.5% |
| Menominee | 0.0 /100 | #301 | Tragic 2.5% |
| Spanish American Indians | 0.0 /100 | #302 | Tragic 2.6% |
| Immigrants | Cabo Verde | 0.0 /100 | #303 | Tragic 2.6% |
| Aleuts | 0.0 /100 | #304 | Tragic 2.6% |
| Hispanics or Latinos | 0.0 /100 | #305 | Tragic 2.6% |
| Iroquois | 0.0 /100 | #306 | Tragic 2.6% |
| Immigrants | Dominican Republic | 0.0 /100 | #307 | Tragic 2.6% |
| Arapaho | 0.0 /100 | #308 | Tragic 2.6% |
Demographics Similar to South American Indians by Vision Disability
In terms of vision disability, the demographic groups most similar to South American Indians are Swiss (2.2%, a difference of 0.11%), Lebanese (2.2%, a difference of 0.20%), Brazilian (2.1%, a difference of 0.32%), Immigrants from Africa (2.1%, a difference of 0.34%), and Immigrants from England (2.1%, a difference of 0.36%).
| Demographics | Rating | Rank | Vision Disability |
| Hungarians | 67.4 /100 | #162 | Good 2.1% |
| Icelanders | 66.1 /100 | #163 | Good 2.1% |
| Immigrants | Bangladesh | 65.5 /100 | #164 | Good 2.1% |
| Immigrants | Iraq | 64.8 /100 | #165 | Good 2.1% |
| Immigrants | England | 62.8 /100 | #166 | Good 2.1% |
| Immigrants | Africa | 62.6 /100 | #167 | Good 2.1% |
| Brazilians | 62.2 /100 | #168 | Good 2.1% |
| South American Indians | 57.4 /100 | #169 | Average 2.2% |
| Swiss | 55.7 /100 | #170 | Average 2.2% |
| Lebanese | 54.3 /100 | #171 | Average 2.2% |
| Northern Europeans | 50.1 /100 | #172 | Average 2.2% |
| Scandinavians | 50.0 /100 | #173 | Average 2.2% |
| Immigrants | Canada | 50.0 /100 | #174 | Average 2.2% |
| Immigrants | Fiji | 47.6 /100 | #175 | Average 2.2% |
| Yugoslavians | 46.5 /100 | #176 | Average 2.2% |