Menominee vs Puerto Rican Average Family Size
COMPARE
Menominee
Puerto Rican
Average Family Size
Average Family Size Comparison
Menominee
Puerto Ricans
3.30
AVERAGE FAMILY SIZE
99.4/ 100
METRIC RATING
90th/ 347
METRIC RANK
3.28
AVERAGE FAMILY SIZE
96.7/ 100
METRIC RATING
109th/ 347
METRIC RANK
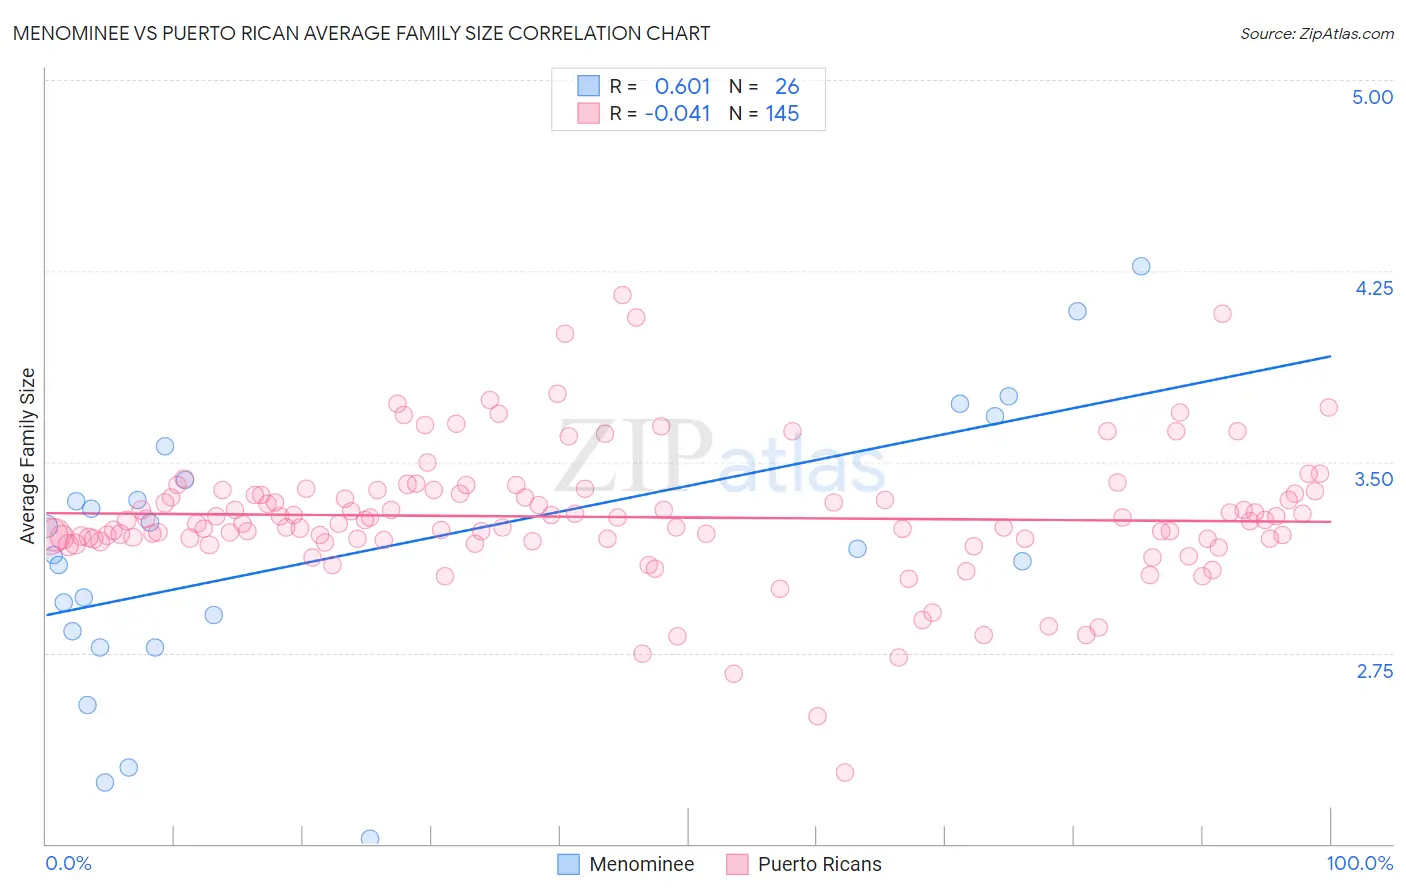
Menominee vs Puerto Rican Average Family Size Correlation Chart
The statistical analysis conducted on geographies consisting of 45,777,849 people shows a significant positive correlation between the proportion of Menominee and average family size in the United States with a correlation coefficient (R) of 0.601 and weighted average of 3.30. Similarly, the statistical analysis conducted on geographies consisting of 527,724,175 people shows no correlation between the proportion of Puerto Ricans and average family size in the United States with a correlation coefficient (R) of -0.041 and weighted average of 3.28, a difference of 0.81%.
Average Family Size Correlation Summary
| Measurement | Menominee | Puerto Rican |
| Minimum | 2.02 | 2.28 |
| Maximum | 4.27 | 4.16 |
| Range | 2.25 | 1.88 |
| Mean | 3.15 | 3.28 |
| Median | 3.15 | 3.27 |
| Interquartile 25% (IQ1) | 2.83 | 3.20 |
| Interquartile 75% (IQ3) | 3.43 | 3.38 |
| Interquartile Range (IQR) | 0.60 | 0.18 |
| Standard Deviation (Sample) | 0.54 | 0.26 |
| Standard Deviation (Population) | 0.53 | 0.26 |
Demographics Similar to Menominee and Puerto Ricans by Average Family Size
In terms of average family size, the demographic groups most similar to Menominee are Malaysian (3.31, a difference of 0.11%), Immigrants from Pakistan (3.30, a difference of 0.15%), Immigrants from Cameroon (3.30, a difference of 0.16%), Peruvian (3.30, a difference of 0.17%), and Sierra Leonean (3.30, a difference of 0.27%). Similarly, the demographic groups most similar to Puerto Ricans are Asian (3.28, a difference of 0.050%), Ghanaian (3.29, a difference of 0.22%), Paiute (3.29, a difference of 0.24%), Immigrants from Ghana (3.29, a difference of 0.25%), and Bolivian (3.29, a difference of 0.31%).
| Demographics | Rating | Rank | Average Family Size |
| Malaysians | 99.6 /100 | #89 | Exceptional 3.31 |
| Menominee | 99.4 /100 | #90 | Exceptional 3.30 |
| Immigrants | Pakistan | 99.2 /100 | #91 | Exceptional 3.30 |
| Immigrants | Cameroon | 99.2 /100 | #92 | Exceptional 3.30 |
| Peruvians | 99.2 /100 | #93 | Exceptional 3.30 |
| Sierra Leoneans | 99.0 /100 | #94 | Exceptional 3.30 |
| Immigrants | Lebanon | 99.0 /100 | #95 | Exceptional 3.30 |
| U.S. Virgin Islanders | 98.8 /100 | #96 | Exceptional 3.29 |
| Immigrants | Oceania | 98.7 /100 | #97 | Exceptional 3.29 |
| Barbadians | 98.6 /100 | #98 | Exceptional 3.29 |
| Nigerians | 98.6 /100 | #99 | Exceptional 3.29 |
| Guamanians/Chamorros | 98.6 /100 | #100 | Exceptional 3.29 |
| Immigrants | Burma/Myanmar | 98.6 /100 | #101 | Exceptional 3.29 |
| West Indians | 98.5 /100 | #102 | Exceptional 3.29 |
| Immigrants | Western Africa | 98.4 /100 | #103 | Exceptional 3.29 |
| Bolivians | 98.3 /100 | #104 | Exceptional 3.29 |
| Immigrants | Ghana | 98.1 /100 | #105 | Exceptional 3.29 |
| Paiute | 98.0 /100 | #106 | Exceptional 3.29 |
| Ghanaians | 98.0 /100 | #107 | Exceptional 3.29 |
| Asians | 97.0 /100 | #108 | Exceptional 3.28 |
| Puerto Ricans | 96.7 /100 | #109 | Exceptional 3.28 |