Menominee vs Panamanian In Labor Force | Age 20-64
COMPARE
Menominee
Panamanian
In Labor Force | Age 20-64
In Labor Force | Age 20-64 Comparison
Menominee
Panamanians
75.3%
IN LABOR FORCE | AGE 20-64
0.0/ 100
METRIC RATING
325th/ 347
METRIC RANK
79.1%
IN LABOR FORCE | AGE 20-64
5.7/ 100
METRIC RATING
228th/ 347
METRIC RANK
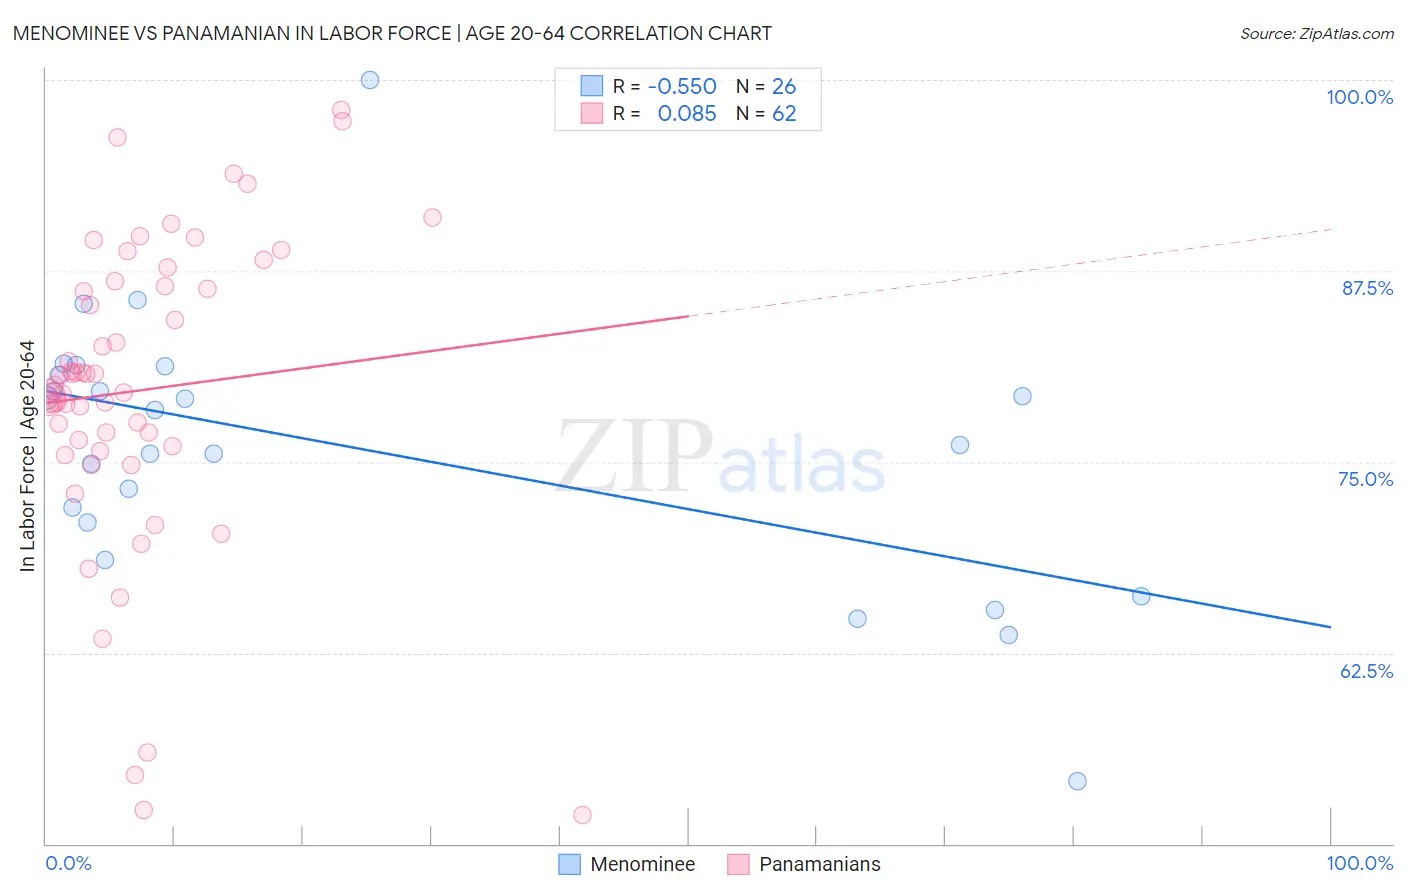
Menominee vs Panamanian In Labor Force | Age 20-64 Correlation Chart
The statistical analysis conducted on geographies consisting of 45,777,849 people shows a substantial negative correlation between the proportion of Menominee and labor force participation rate among population between the ages 20 and 64 in the United States with a correlation coefficient (R) of -0.550 and weighted average of 75.3%. Similarly, the statistical analysis conducted on geographies consisting of 281,243,301 people shows a slight positive correlation between the proportion of Panamanians and labor force participation rate among population between the ages 20 and 64 in the United States with a correlation coefficient (R) of 0.085 and weighted average of 79.1%, a difference of 5.1%.
In Labor Force | Age 20-64 Correlation Summary
| Measurement | Menominee | Panamanian |
| Minimum | 54.1% | 51.9% |
| Maximum | 100.0% | 98.0% |
| Range | 45.9% | 46.1% |
| Mean | 75.8% | 79.7% |
| Median | 77.2% | 79.8% |
| Interquartile 25% (IQ1) | 71.0% | 76.0% |
| Interquartile 75% (IQ3) | 80.7% | 86.5% |
| Interquartile Range (IQR) | 9.7% | 10.5% |
| Standard Deviation (Sample) | 8.9% | 10.1% |
| Standard Deviation (Population) | 8.8% | 10.0% |
Similar Demographics by In Labor Force | Age 20-64
Demographics Similar to Menominee by In Labor Force | Age 20-64
In terms of in labor force | age 20-64, the demographic groups most similar to Menominee are Choctaw (75.4%, a difference of 0.14%), Cajun (75.5%, a difference of 0.19%), Creek (75.1%, a difference of 0.22%), Dutch West Indian (75.5%, a difference of 0.23%), and Seminole (75.5%, a difference of 0.28%).
| Demographics | Rating | Rank | In Labor Force | Age 20-64 |
| Chickasaw | 0.0 /100 | #318 | Tragic 76.2% |
| Inupiat | 0.0 /100 | #319 | Tragic 76.1% |
| Yakama | 0.0 /100 | #320 | Tragic 75.8% |
| Seminole | 0.0 /100 | #321 | Tragic 75.5% |
| Dutch West Indians | 0.0 /100 | #322 | Tragic 75.5% |
| Cajuns | 0.0 /100 | #323 | Tragic 75.5% |
| Choctaw | 0.0 /100 | #324 | Tragic 75.4% |
| Menominee | 0.0 /100 | #325 | Tragic 75.3% |
| Creek | 0.0 /100 | #326 | Tragic 75.1% |
| Sioux | 0.0 /100 | #327 | Tragic 75.0% |
| Kiowa | 0.0 /100 | #328 | Tragic 75.0% |
| Cheyenne | 0.0 /100 | #329 | Tragic 74.8% |
| Colville | 0.0 /100 | #330 | Tragic 74.8% |
| Paiute | 0.0 /100 | #331 | Tragic 74.7% |
| Arapaho | 0.0 /100 | #332 | Tragic 74.4% |
Demographics Similar to Panamanians by In Labor Force | Age 20-64
In terms of in labor force | age 20-64, the demographic groups most similar to Panamanians are Alsatian (79.1%, a difference of 0.0%), Native Hawaiian (79.1%, a difference of 0.0%), Central American (79.1%, a difference of 0.010%), Immigrants from Western Europe (79.1%, a difference of 0.010%), and Portuguese (79.1%, a difference of 0.020%).
| Demographics | Rating | Rank | In Labor Force | Age 20-64 |
| Hungarians | 7.2 /100 | #221 | Tragic 79.2% |
| Immigrants | Panama | 6.9 /100 | #222 | Tragic 79.1% |
| Canadians | 6.8 /100 | #223 | Tragic 79.1% |
| Immigrants | Uzbekistan | 6.8 /100 | #224 | Tragic 79.1% |
| Portuguese | 6.4 /100 | #225 | Tragic 79.1% |
| Central Americans | 5.9 /100 | #226 | Tragic 79.1% |
| Immigrants | Western Europe | 5.9 /100 | #227 | Tragic 79.1% |
| Panamanians | 5.7 /100 | #228 | Tragic 79.1% |
| Alsatians | 5.7 /100 | #229 | Tragic 79.1% |
| Native Hawaiians | 5.6 /100 | #230 | Tragic 79.1% |
| Lebanese | 5.1 /100 | #231 | Tragic 79.1% |
| Guamanians/Chamorros | 4.5 /100 | #232 | Tragic 79.1% |
| Japanese | 4.0 /100 | #233 | Tragic 79.1% |
| Immigrants | Canada | 3.2 /100 | #234 | Tragic 79.0% |
| Tlingit-Haida | 3.2 /100 | #235 | Tragic 79.0% |