Immigrants from Germany vs Panamanian Average Family Size
COMPARE
Immigrants from Germany
Panamanian
Average Family Size
Average Family Size Comparison
Immigrants from Germany
Panamanians
3.15
AVERAGE FAMILY SIZE
0.7/ 100
METRIC RATING
271st/ 347
METRIC RANK
3.25
AVERAGE FAMILY SIZE
84.2/ 100
METRIC RATING
135th/ 347
METRIC RANK
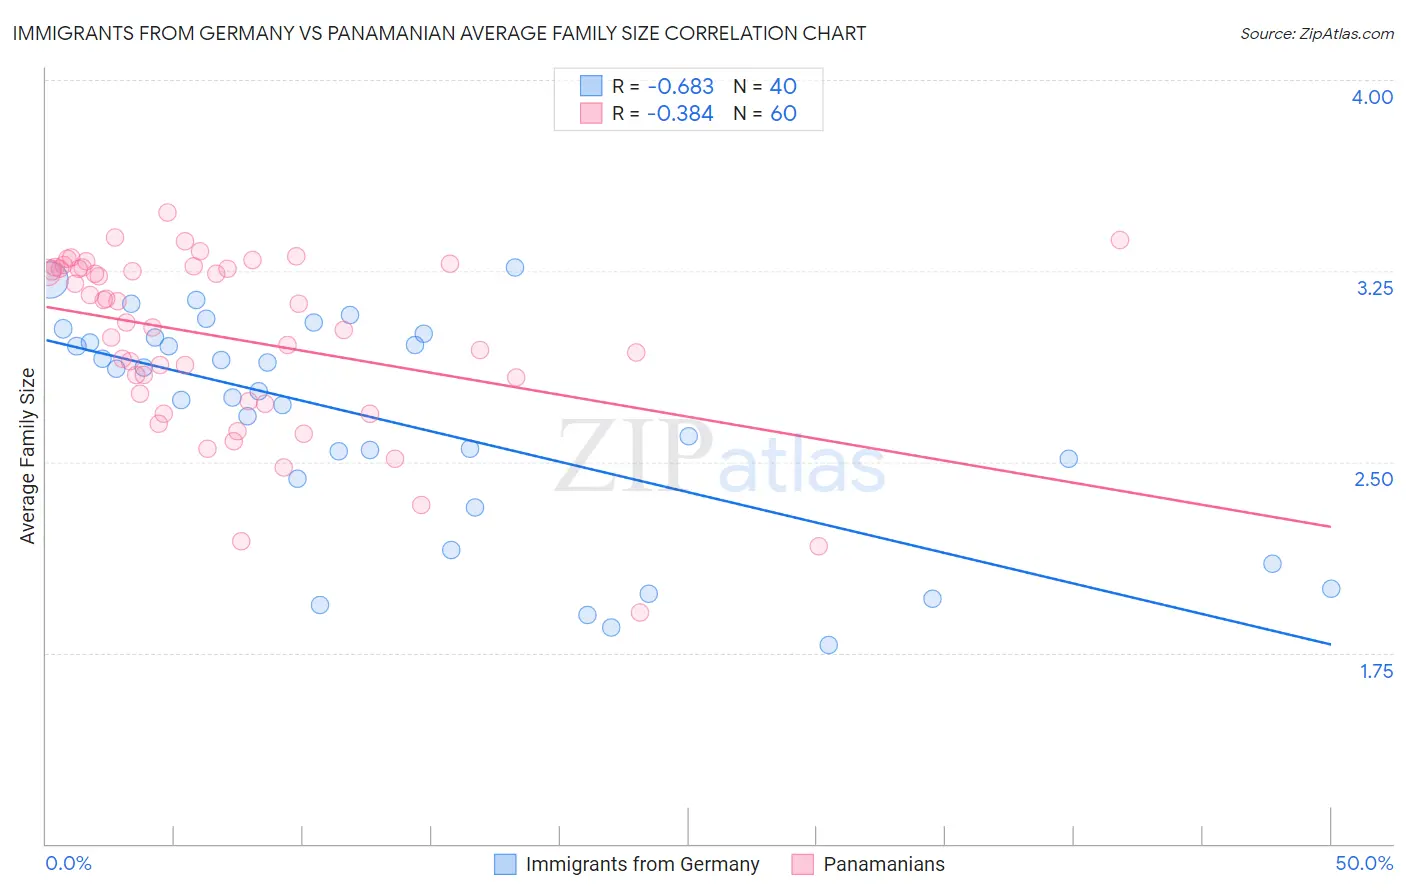
Immigrants from Germany vs Panamanian Average Family Size Correlation Chart
The statistical analysis conducted on geographies consisting of 463,759,873 people shows a significant negative correlation between the proportion of Immigrants from Germany and average family size in the United States with a correlation coefficient (R) of -0.683 and weighted average of 3.15. Similarly, the statistical analysis conducted on geographies consisting of 281,072,582 people shows a mild negative correlation between the proportion of Panamanians and average family size in the United States with a correlation coefficient (R) of -0.384 and weighted average of 3.25, a difference of 3.1%.
Average Family Size Correlation Summary
| Measurement | Immigrants from Germany | Panamanian |
| Minimum | 1.78 | 1.91 |
| Maximum | 3.26 | 3.48 |
| Range | 1.48 | 1.57 |
| Mean | 2.65 | 2.98 |
| Median | 2.77 | 3.08 |
| Interquartile 25% (IQ1) | 2.38 | 2.75 |
| Interquartile 75% (IQ3) | 2.98 | 3.26 |
| Interquartile Range (IQR) | 0.60 | 0.51 |
| Standard Deviation (Sample) | 0.43 | 0.35 |
| Standard Deviation (Population) | 0.43 | 0.34 |
Similar Demographics by Average Family Size
Demographics Similar to Immigrants from Germany by Average Family Size
In terms of average family size, the demographic groups most similar to Immigrants from Germany are Tlingit-Haida (3.16, a difference of 0.020%), Immigrants from Lithuania (3.15, a difference of 0.020%), New Zealander (3.15, a difference of 0.030%), Immigrants from Belgium (3.15, a difference of 0.030%), and Cambodian (3.15, a difference of 0.040%).
| Demographics | Rating | Rank | Average Family Size |
| Americans | 1.0 /100 | #264 | Tragic 3.16 |
| Immigrants | South Africa | 0.9 /100 | #265 | Tragic 3.16 |
| Immigrants | Greece | 0.9 /100 | #266 | Tragic 3.16 |
| Iroquois | 0.8 /100 | #267 | Tragic 3.16 |
| Maltese | 0.8 /100 | #268 | Tragic 3.16 |
| Immigrants | Singapore | 0.7 /100 | #269 | Tragic 3.16 |
| Tlingit-Haida | 0.7 /100 | #270 | Tragic 3.16 |
| Immigrants | Germany | 0.7 /100 | #271 | Tragic 3.15 |
| Immigrants | Lithuania | 0.6 /100 | #272 | Tragic 3.15 |
| New Zealanders | 0.6 /100 | #273 | Tragic 3.15 |
| Immigrants | Belgium | 0.6 /100 | #274 | Tragic 3.15 |
| Cambodians | 0.6 /100 | #275 | Tragic 3.15 |
| Immigrants | Bosnia and Herzegovina | 0.5 /100 | #276 | Tragic 3.15 |
| Swiss | 0.5 /100 | #277 | Tragic 3.15 |
| Okinawans | 0.5 /100 | #278 | Tragic 3.15 |
Demographics Similar to Panamanians by Average Family Size
In terms of average family size, the demographic groups most similar to Panamanians are African (3.25, a difference of 0.020%), Comanche (3.25, a difference of 0.050%), Immigrants from Middle Africa (3.25, a difference of 0.060%), Immigrants from Venezuela (3.26, a difference of 0.070%), and Cuban (3.25, a difference of 0.080%).
| Demographics | Rating | Rank | Average Family Size |
| Colombians | 89.9 /100 | #128 | Excellent 3.26 |
| Immigrants | Hong Kong | 88.6 /100 | #129 | Excellent 3.26 |
| Laotians | 88.5 /100 | #130 | Excellent 3.26 |
| Immigrants | Western Asia | 87.7 /100 | #131 | Excellent 3.26 |
| Costa Ricans | 86.8 /100 | #132 | Excellent 3.26 |
| Immigrants | Venezuela | 86.3 /100 | #133 | Excellent 3.26 |
| Africans | 84.9 /100 | #134 | Excellent 3.25 |
| Panamanians | 84.2 /100 | #135 | Excellent 3.25 |
| Comanche | 82.8 /100 | #136 | Excellent 3.25 |
| Immigrants | Middle Africa | 82.4 /100 | #137 | Excellent 3.25 |
| Cubans | 81.8 /100 | #138 | Excellent 3.25 |
| Immigrants | Ethiopia | 81.6 /100 | #139 | Excellent 3.25 |
| Sub-Saharan Africans | 81.6 /100 | #140 | Excellent 3.25 |
| Venezuelans | 81.4 /100 | #141 | Excellent 3.25 |
| Liberians | 81.2 /100 | #142 | Excellent 3.25 |